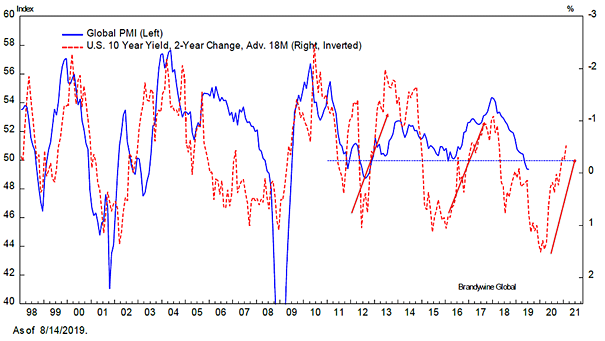
U.S. 10-Year Yield Leads Global PMI
U.S. 10-Year Yield Leads Global PMI This interesting chart suggests that the U.S. 10-year yield (2-year change) leads global PMI by 18 months. Source: Macrobond and Brandywine Global
U.S. 10-Year Yield Leads Global PMI This interesting chart suggests that the U.S. 10-year yield (2-year change) leads global PMI by 18 months. Source: Macrobond and Brandywine Global
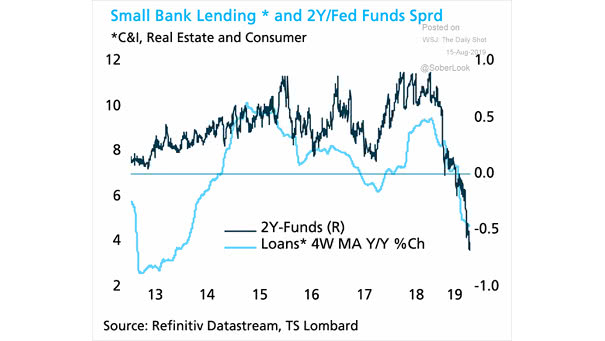
Small Bank Lending and 2-Year/Fed Funds Spread This chart shows the correlation between small bank lending and falling rates, and the negative effect of an inverted yield curve on small bank lending. Image: TS Lombard

The Yield Curve Leads VIX (Volatility) by Three Years Is more volatility expected ahead? This chart suggests that the CBOE Volatility Index or VIX usually follows the U.S. 10-year vs. 2-year Treasury spread (inverted) with a 3-year lag. Image: Morgan Stanley Research
Gold vs. Short-term Treasury Yield This chart shows the correlation between gold and 2-year treasury yield (inverse). Gold rises on slowing global growth and short-term treasury yield inverse. Image: Jeroen Blokland