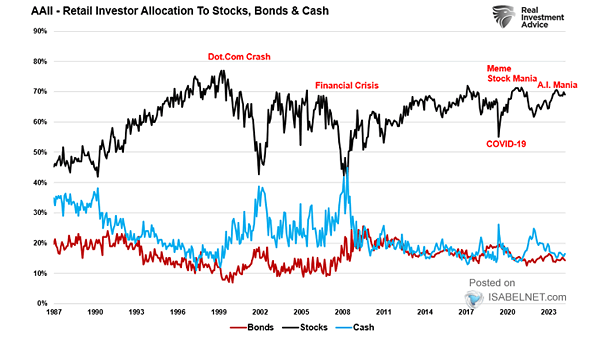
AAII – U.S. Retail Investors Allocation to Stocks, Bonds and Cash
AAII – U.S. Retail Investors Allocation to Stocks, Bonds and Cash High equity allocations and low cash positions don’t always mean a market reversal is near. However, they suggest that much of the market’s potential gains may already be priced in, as investors have heavily committed to equities. Image: Real Investment Advice