U.S. Dollar Index vs. Medium-Term Fair Value
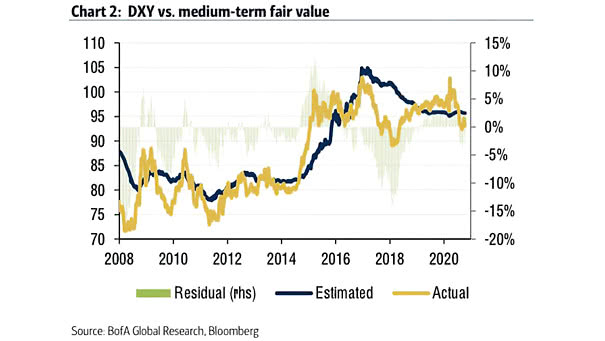
U.S. Dollar Index vs. Medium-Term Fair Value The U.S. dollar continues to be below medium-term fair value levels over the business cycle. Image: BofA Global Research
U.S. Dollar Index vs. Medium-Term Fair Value The U.S. dollar continues to be below medium-term fair value levels over the business cycle. Image: BofA Global Research
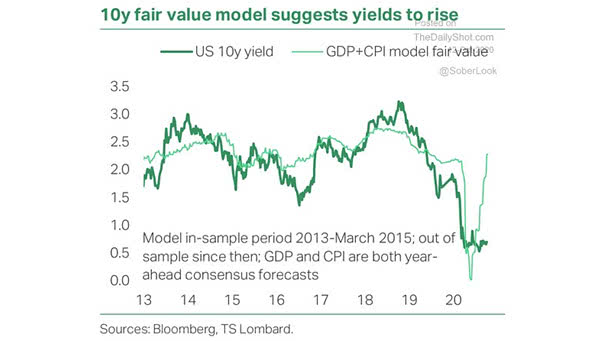
U.S. 10-Year Yield vs. GDP + CPI Model Fair Value Are higher Treasury yields coming, as suggested by this model? Image: TS Lombard

Valuation – U.S. 10-Year Treasury Yield vs. Fair Value Chart suggesting that U.S. 10-year Treasuries are extremely overvalued. Image: BCA Research
U.S. Retail Sales and Food Services vs. Fair Value Model After disappointing U.S. retail sales in September, this chart provides a good forward guide for U.S. consumer spending. The Fair Value Model leads consumption and includes: ASA Staffing Index (temps), spread between good unemployment (job leavers) and bad unemployment (job losers), and forward-looking income expectations.…
Oil – Brent Fair-Value Model J.P. Morgan expects Brent oil prices to exit the year at $86/bbl. Image: J.P. Morgan
Leon Cooperman: Bull Market Cycles Don’t End at Fair Valuation, They Ended at Overvaluation “There is still more room for the market to run. We have a slowdown but not a recession and the market is ok.” Leon Cooperman (Omega Advisors founder) is a great value investor. https://www.youtube.com/watch?v=Xz6ihkuW1AM
Valuation – S&P 500 Company Actual vs. Modeled FY2 P/E Ratio Valuations for the Magnificent Seven now sit slightly below modeled fair value, especially in light of their robust fundamentals and earnings growth. Image: Goldman Sachs Global Investment Research
Valuation – S&P 500 Based on Rule of 20 According to the historically reliable “Rule of 20,” the market is fairly valued when the P/E ratio plus the inflation rate equals 20. By this measure, the S&P 500’s fair value is about 4,600 today. Image: Bloomberg
Valuation – Equal-Weight S&P 500 P/E Multiple According to Goldman Sachs, the equal-weight S&P 500 P/E multiple is currently 13% above fair value. This suggests that stocks in the S&P 500 Equal Weight Index may be relatively more expensive compared to their earnings potential. Image: Goldman Sachs Global Investment Research
Ratio of 3-Month to 6-Month Realized Volatilities for Bitcoin vs. the Corresponding Volatilities for Gold According to J.P. Morgan, the current fair value for Bitcoin based on a volatility ratio of Bitcoin to gold is US$23,000. Image: J.P. Morgan
Outlook 2020: S&P 500 Target, GDP Growth Estimate and 10-Year U.S. Treasury Yield LPL expects 1.75% U.S. GDP growth in 2020. The S&P 500 Index fair value target range is 3,200–3,300 by year-end 2020, and the 10-year U.S. Treasury yield target range is 2-2.25%. Image: LPL Research