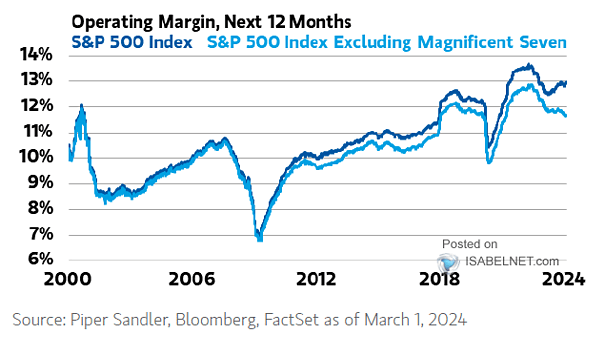
S&P 500 Index – Estimated Next 12-Month Operating Margin
S&P 500 Index – Estimated Next 12-Month Operating Margin The decline in S&P 500 operating margins excluding the Magnificent Seven persists, suggesting that margin headwinds could remain challenging. Image: Morgan Stanley Wealth Management