Valuation – Russell 2000 Forward P/E

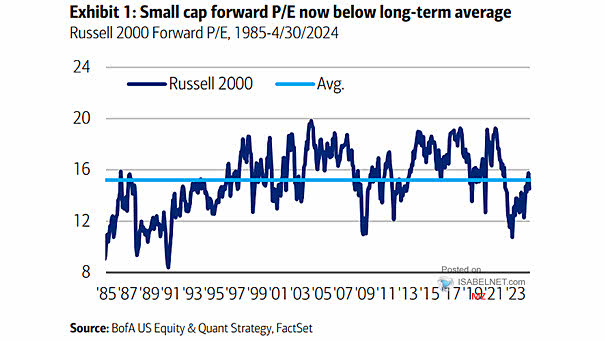
Valuation – Russell 2000 Forward P/E The April sell-off has brought the U.S. small-cap forward P/E ratio back below the historical average, suggesting a potential undervaluation of small-cap stocks and creating buying opportunities for long-term investors. Image: BofA US Equity & Quant Strategy

Valuation – S&P 500 Forward P/E

Valuation – S&P 500 Forward P/E Ratio The valuation of the S&P 500 index tends to expand after the Fed’s first cut, providing valuable insight into the potential impact of the Fed’s decisions on the U.S. stock market. Image: Goldman Sachs Global Investment Research

Valuation – S&P 500 Forward PE Ratio

Valuation – S&P 500 Forward PE Ratio The forward P/E ratio of the S&P 500 is 19.77 and remains at high level. The historical range is about 15.5 to 17. Image: Bianco Research

Developed Market Valuations

Developed Market Valuations While the macroeconomic outlook has weakened, the U.S. stock market’s forward P/E ratio has moved back toward pre-Liberation Day levels. Image: TS Lombard

S&P 500 Valuation Metrics

S&P 500 Valuation Metrics While the current forward P/E ratio of 21.6x for the S&P 500 is high by historical standards, it has moderated somewhat from its recent highs. Image: Goldman Sachs Global Investment Research

Valuation – S&P 500 Operating Earnings Per Share

Valuation – S&P 500 Operating Earnings Per Share If companies are able to maintain their profit margins, the forward P/E ratio of the S&P 500 could fall to 20.1x by 4Q22. Image: J.P. Morgan Asset Management

Is The U.S. Stock Market Overvalued?

Is The U.S. Stock Market Overvalued? S&P 500 Valuation: the chart shows that the U.S. stock market is not cheap. Based on the forward P/E ratio, the S&P 500 is not extremely overvalued either. You may also like our “Stock Market Valuation.” Image: Bianco Research