Jul
02
2026
Off
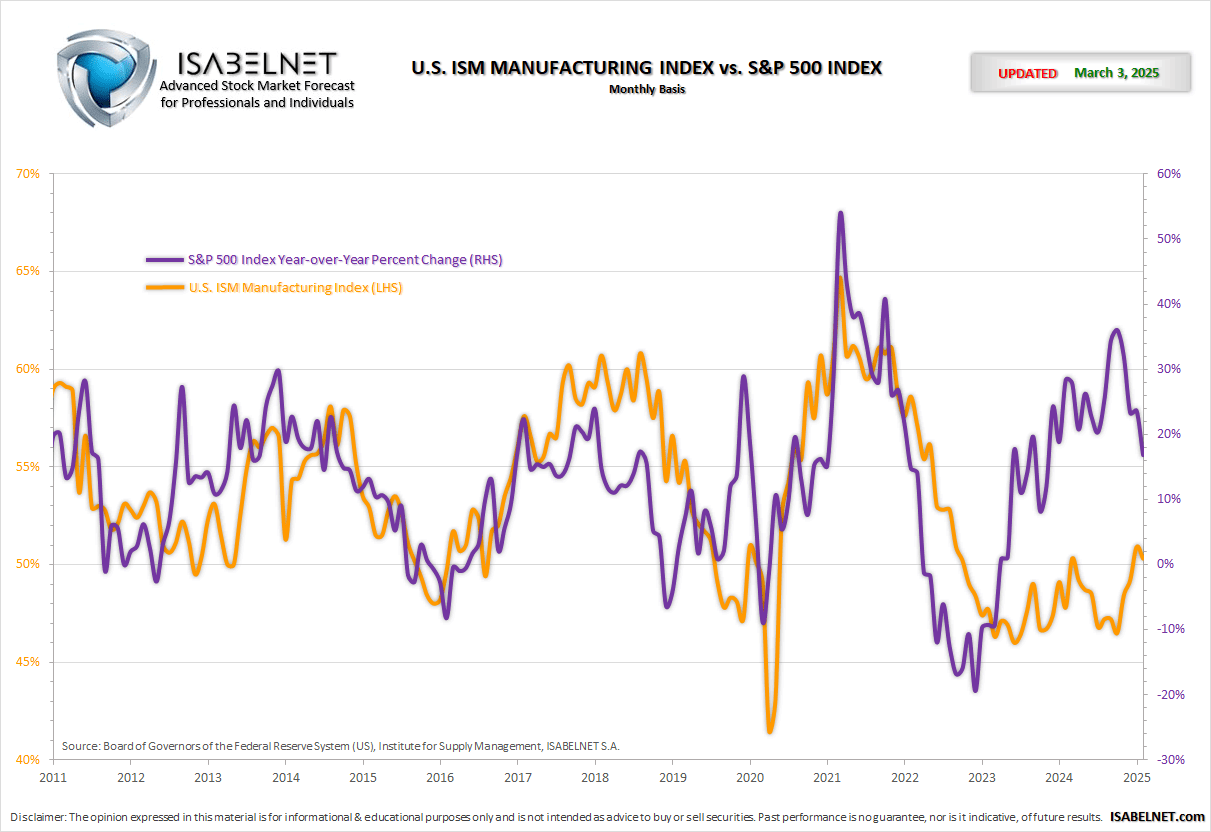
ISM Manufacturing Index vs. S&P 500 Index
U.S. manufacturing lost some steam in June, with the ISM Manufacturing Index slipping to 53.3, missing expectations of 54, but still marking a sixth straight month of expansion. Under the surface, momentum remains intact.
The chart shows the correlation between the U.S. ISM Manufacturing Index and the S&P 500 index year-over-year percent change, since 2011.