Annual Total Returns
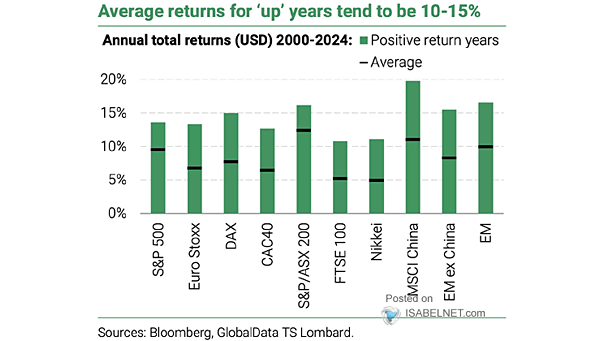
Annual Total Returns While most markets average 5-10% returns annually, positive years can push this average to 10-15%, highlighting the potential for higher gains during favorable market conditions. Image: TS Lombard
Annual Total Returns While most markets average 5-10% returns annually, positive years can push this average to 10-15%, highlighting the potential for higher gains during favorable market conditions. Image: TS Lombard
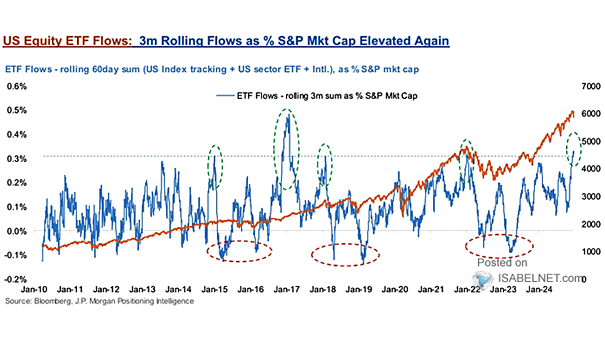
U.S. Equity ETF Flows Inflows to U.S. equity ETFs as a percentage of S&P 500 market cap have reached elevated levels, reflecting strong investor confidence in U.S. equities. Image: J.P. Morgan Positioning Intelligence
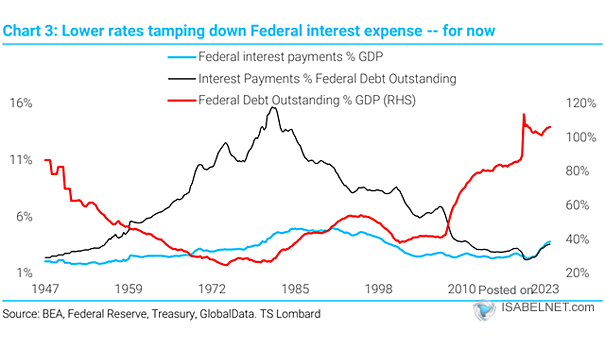
Federal Debt Outstanding % GDP and Federal Interest Payments % GDP Recent interest rate cuts are easing federal interest expenses but raise concerns about long-term fiscal sustainability, as interest payments are expected to increase significantly…

ISABELNET Cartoon of the Day While bulls have faced significant challenges this week due to limited rate cuts in 2025 and market volatility, bears are finding reasons to be optimistic about potential corrections in the…
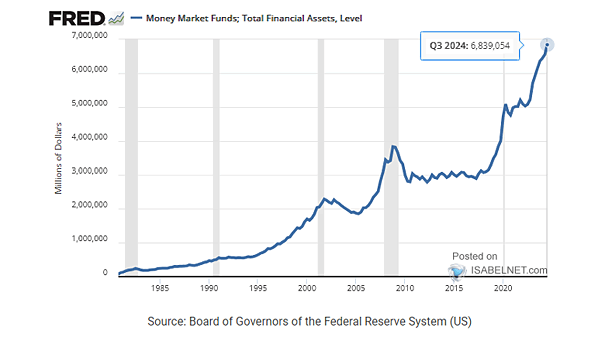
U.S. Money Market Funds Following the Fed’s first rate cut, U.S. money market funds typically experience outflows within 12 months as investors rebalance portfolios and reassess risk in response to changing interest rates and market…
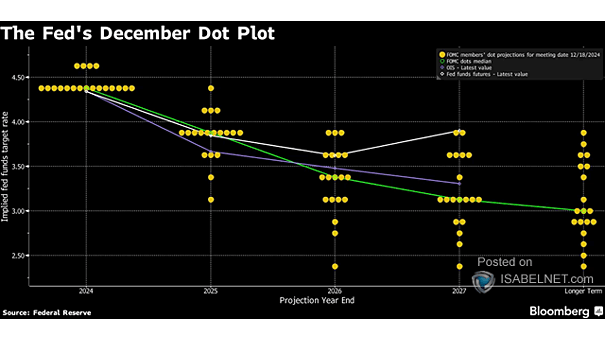
Implied Fed Funds Target Rate The Fed has revised its 2025 projections, now anticipating only two rate cuts instead of four, with future reductions dependent on the progress made in managing inflation. Image: Bloomberg

ISABELNET Cartoon of the Day With Bitcoin surpassing $100,000, bears are now on dating apps looking for a bull! Have a Great Day, Everyone! 😎
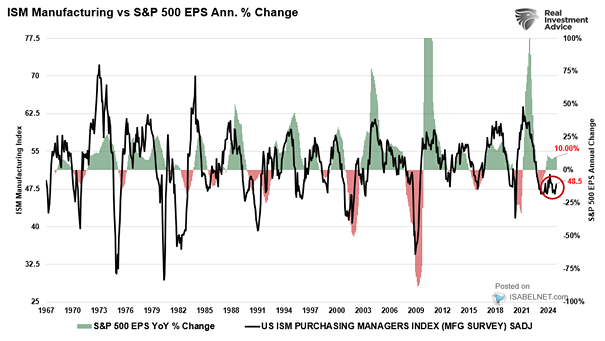
U.S. ISM Manufacturing Index vs. S&P 500 EPS Annual % Change With the ISM Manufacturing Index still in contraction territory and strongly correlated with S&P 500 earnings growth, questions arise about the resilience of corporate…
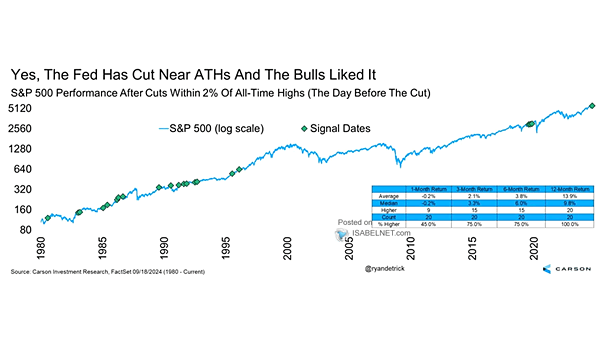
S&P 500 Performance After Fed Cuts Within 2% of All-Time Highs Bulls rejoice! Since 1980, when the S&P 500 was within 2% of its all-time high during a Fed rate cut, it has been positive…
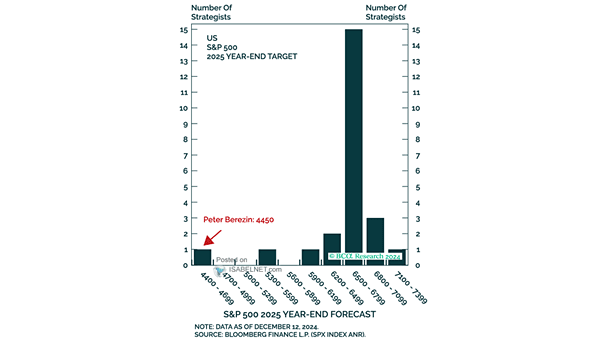
S&P 500 2025 Year-End Target While most strategists project a bullish 2025 for the S&P 500, a notable minority advocates for caution. This divergence in opinion could comfort investors wary of market euphoria. Image: BCA…
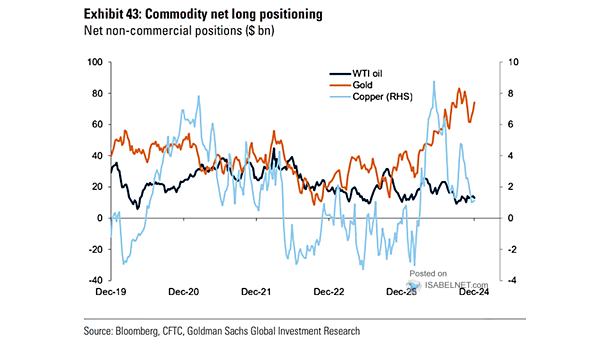
Commodities (Oil, Gold, Copper) – Commodity Net Long Positioning While there are some pressures from rising U.S. Treasury yields and a stronger U.S. dollar, the current landscape for gold positioning is marked by a robust…