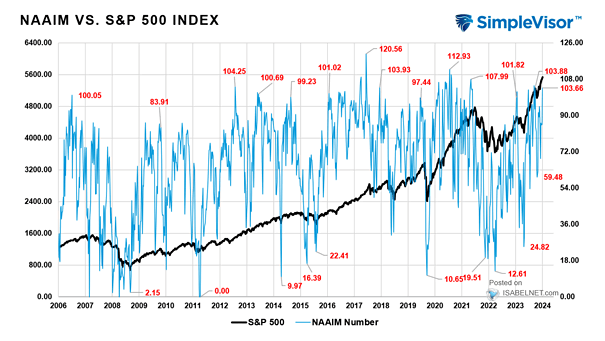
S&P 500 Performance After Four Week Win Streak >10%

S&P 500 Performance After Four Week Win Streak >10% When the S&P 500 experiences four consecutive weeks of gains and achieves a cumulative increase of over 10% throughout this period, it can be interpreted as…

Passive vs. Active Rolling 6-Month Flows

Passive vs. Active Rolling 6-Month Flows Flows into passive mutual funds and ETFs continue to surpass those into active funds. This trend is driven by factors such as lower costs, strong performance, and the rise…

Number of Global Central Bank Hikes and Cuts

Number of Global Central Bank Hikes and Cuts The current trend of global central banks cutting interest rates at the fastest pace since August 2020 could significantly impact financial markets, borrowing costs, and overall economic…

Valuation – S&P 500 Normalized P/E Ratio

Valuation – S&P 500 Normalized P/E Ratio At 22x, the S&P 500 is currently trading over 40% above the long-term average, which suggests that investors are willing to pay a premium for stocks in the…

A Typical 10%+ Selloff in the S&P 500

A Typical 10%+ Selloff in the S&P 500 The speed and magnitude of a rally following a correction can vary. The recent rally in the S&P 500 has been faster than usual, which is indicative…

Distribution of S&P 500 12-Month Total Returns

Distribution of S&P 500 12-Month Total Returns Goldman Sachs, in its base case scenario, expects the S&P 500 index to generate a total return of 6% in 2024, which is slightly below the average return…

Banks vs. S&P 500, Relative Price Performance

Banks vs. S&P 500, Relative Price Performance U.S. banks are experiencing their lowest performance relative to the S&P 500 in the past 80 years. Image: BofA Global Investment Strategy