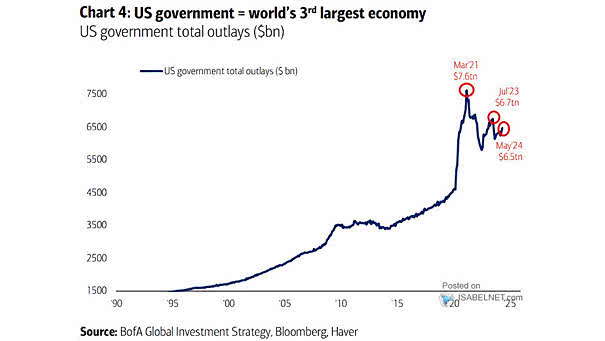
Performance – Discretionary vs. S&P 500
Performance – Discretionary vs. S&P 500 U.S. consumer discretionary stocks are still trading 2 standard deviations above the long-term average relative to the S&P 500. Image: BofA Global Investment Strategy
Long Only Positioning in Value vs. Growth Value is still 53% underweight vs. Growth, highlighting a significant preference among investors for growth-oriented investments over value-based ones. Image: BofA US Equity & Quant Strategy
Fed Funds Target Rate Goldman Sachs predicts that by the end of 2024, the federal funds rate will reach 5.1%, which differs significantly from the expectations of the futures market.. Image: Goldman Sachs Global Investment…
Recession – Conference Board: Consumer Expectations – Current Conditions Gloomy confidence expectations have historically not been a positive sign for the U.S. economy, which can potentially lead to reduced spending and investment. Image: The Daily…
Performance – U.S. vs. Japan Equities Since January 2022, Japan equities have outperformed their U.S. counterparts. Will this trend persist going forward? Image: BofA Global Investment Strategy
U.S. Large Company Stock Total Returns A $1 investment in U.S. large company stocks in 1824 would now be worth $16 million, including reinvested dividends. This growth showcases the wealth-building potential of long-term investing in…
Energy vs. S&P 500, Relative Price Performance Should investors consider overweighting their exposure to energy stocks in their portfolios? Image: BofA Global Investment Strategy
S&P 500 Performance After 7-Day Win Streaks Historically, 7-day win streaks tend to be bullish for U.S. stocks over the next 12 months. Image: Carson Investment Research
S&P 500 vs. Its Seasonal Pattern While past performance does not guarantee future results, can the U.S. stock market continue to follow its seasonal pattern? Image: Topdown Charts
Median Sector Returns in the Year Before U.S. Election Day Given the historical trend of the tech sector underperforming the S&P 500 in the year preceding the U.S. election day, should investors consider underweighting their…
S&P 500 Earnings Revisions Breadth Earnings revisions breadth for both large and small caps has returned to negative territory, which means that the overall sentiment and expectations for future earnings have worsened. Image: Morgan Stanley…