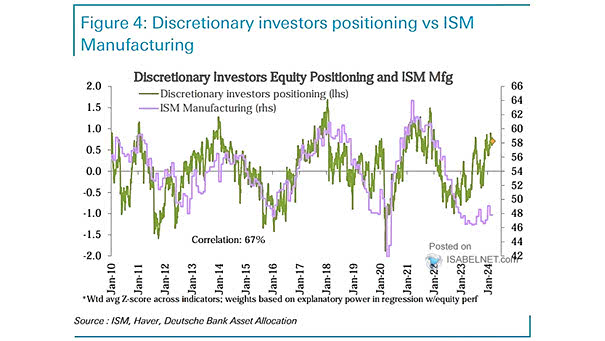
Discretionary Investors Equity Positioning and ISM Manufacturing
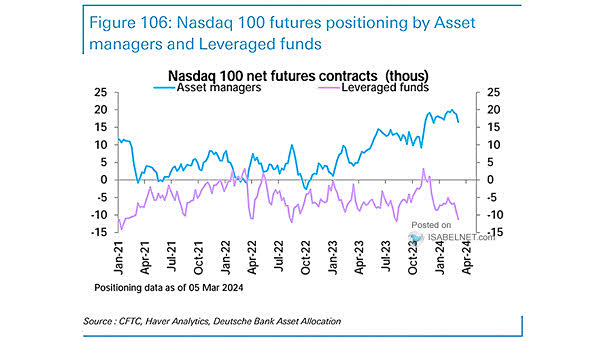
Discretionary Investors Equity Positioning and ISM Manufacturing The current discretionary equity positioning already reflects the idea of a “no landing” scenario. Image: Deutsche Bank Asset Allocation