Valuation – S&P 500 Trailing PE
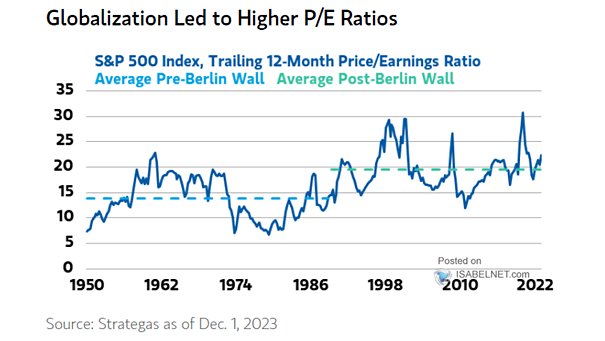
Valuation – S&P 500 Trailing PE After the fall of the Berlin Wall, globalization had a significant impact on various aspects of the global economy, including financial markets, as evidenced by the P/E ratios of…
Valuation – S&P 500 Trailing PE After the fall of the Berlin Wall, globalization had a significant impact on various aspects of the global economy, including financial markets, as evidenced by the P/E ratios of…
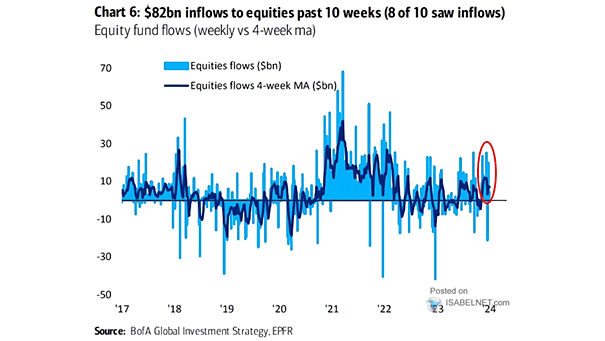
Weekly Equity Fund Flows Equity funds seeing $82 billion inflows over the past 10 weeks indicates the strong confidence investors have in the potential returns in equity markets. Image: BofA Global Investment Strategy
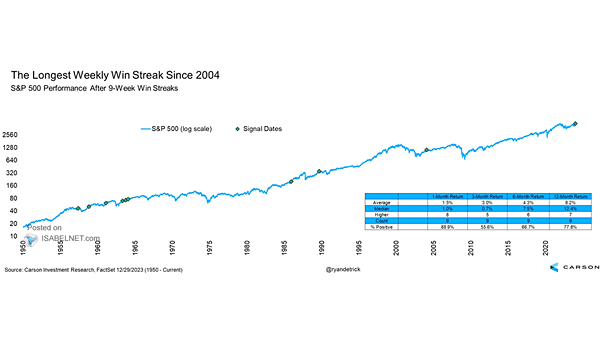
S&P 500 Performance After 9-Week Win Streaks Historically, 9-week win streaks tend to be bullish for U.S. stocks, with a median 12.4% increase in value seen a year later since 1950, giving investors good reason…
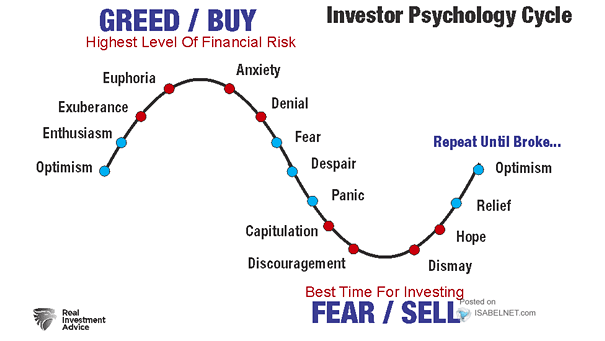
Investor Psychology Cycle When investor psychology is overly negative, it may indicate undervalued market prices, presenting buying opportunities for investors who are able to take a contrarian approach and invest when others are fearful. Image:…
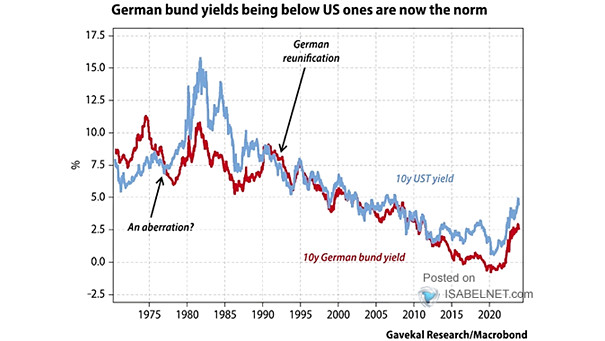
U.S. 10-Year Treasury Yield vs. 10-Year Bund Yield It is becoming more common for German bund yields to be below U.S. yields, which can be attributed to the difference in economic conditions and fiscal policies…
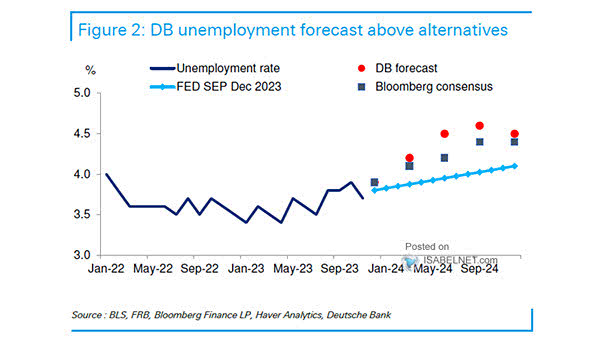
U.S. Unemployment Rate Forecast According to Deutsche Bank, a mild recession in the United States may result in a modestly higher unemployment rate than what is anticipated by both consensus and the Federal Reserve. Image:…
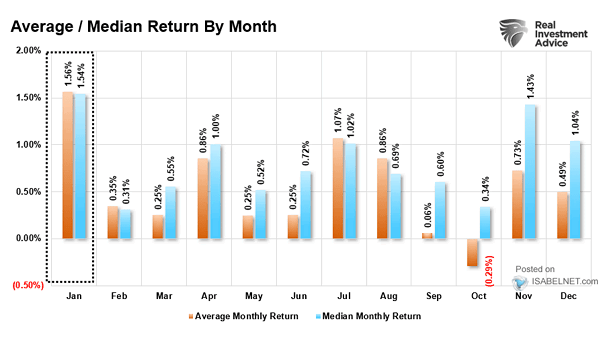
S&P 500 – Average / Median Return by Month January typically emerges as one of the most favorable months for S&P 500 returns. However, February and March often experience a notable decline in returns, presenting…
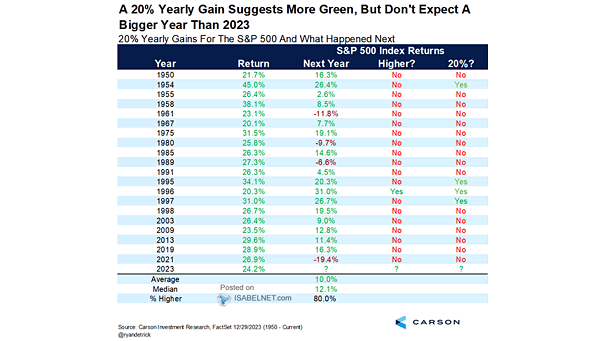
20% Yearly Gains for the S&P 500 Index and What Happened Next A significant annual gain of 20% in the S&P 500 index is often indicative of continued positive performance in the following year, with…
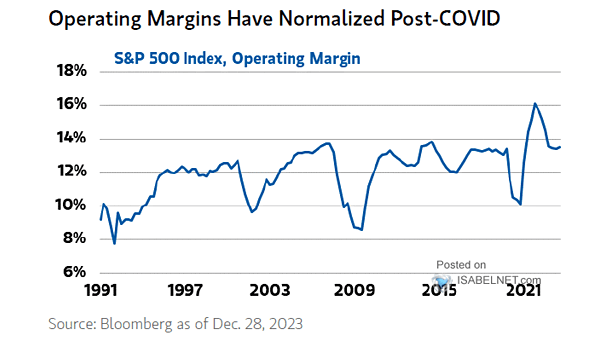
S&P 500 Operating Margin After the COVID-19 pandemic, the operating margins of companies in the S&P 500 have returned to a state of normalcy, leading to a positive trend of improved profitability and cash flows…
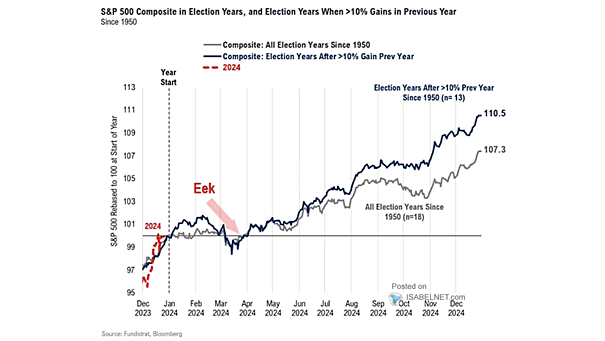
S&P 500 Composite in Elections Years and Election Years When >10% Gains in Previous Year Given the Fed’s interest rate projections, market sentiment indicators and historical market behavior, investors may reasonably expect the S&P 500…
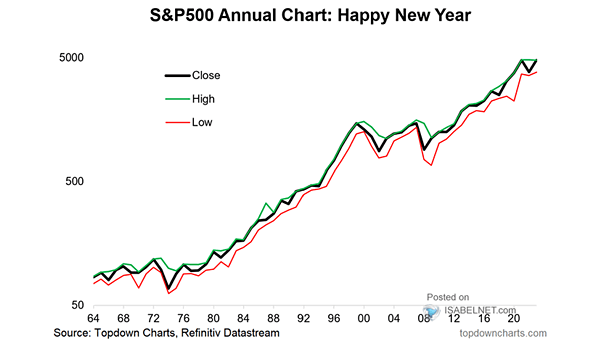
S&P 500 Annual Chart Despite an impressive 24.2% gain in 2023, the S&P 500 index has done virtually nothing over the past two years. When adjusted for inflation, it is still significantly below its peak.…