Fed Discount Window Usage vs. S&P 500
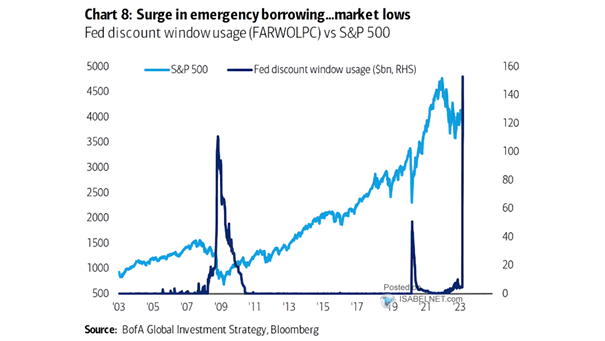
Fed Discount Window Usage vs. S&P 500 The Fed’s discount window borrowing has reached an all time high. What could go wrong? Image: BofA Global Investment Strategy
Fed Discount Window Usage vs. S&P 500 The Fed’s discount window borrowing has reached an all time high. What could go wrong? Image: BofA Global Investment Strategy
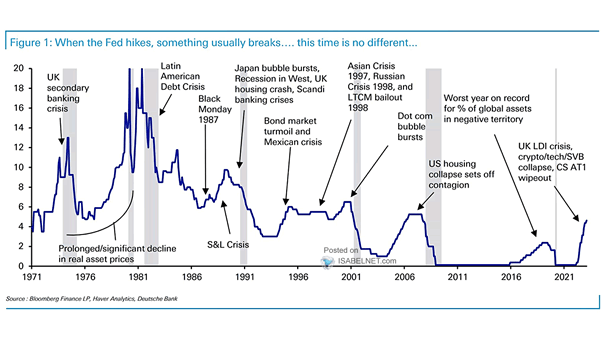
U.S. Fed Funds Rate and Financial Events History repeats itself over and over again, as Fed tightening cycles end with a financial event. Image: Deutsche Bank

S&P 500 Borrow Cost vs. U.S. 10-Year Treasury Yield S&P 500 borrow costs remain low so far. Image: Goldman Sachs Global Investment Research
U.S. Fixed Rate CMBS Index Price Commercial mortgage-backed securities prices are currently at their lowest since October 2009. Image: BofA Global Investment Strategy
FMS Investors – Net % Overweight Banks FMS investors are bearish on banks, while most banks are in very good shape. Image: BofA Global Fund Manager Survey
U.S. Money Market Fund Yields vs. U.S. Bank Deposit Rates Higher rates could lead to deposit flight and increased liquidity risk for U.S. banks. Image: J.P. Morgan
U.S. Household Net Equity Demand by Year U.S. households’ demand for equities could be a headwind for stocks. Image: Goldman Sachs Global Investment Research
S&P 500 Forward EPS S&P 500 forward EPS estimates tend to stabilize. Image: The Daily Shot
Net % Bank Easing Standards for Small Business vs. NFIB Small Business Optimism Tighter lending standards have an impact on small business optimism. Image: BofA Global Investment Strategy
Fed – Rate Hikes at FOMC Meetings When will the Fed stop hiking interest rates? Goldman Sachs expects 75bp additional rate hikes in 2023. Image: Goldman Sachs Global Investment Research
FMS Financial Market Stability Risks Index vs. S&P 500 Financial market stability risks continue to weigh on the S&P 500. Image: BofA Global Fund Manager Survey