S&P Sector Valuation Dashboard
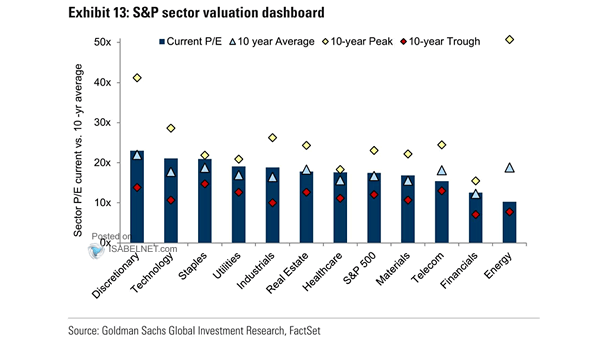
S&P Sector Valuation Dashboard The S&P energy sector still looks attractive. Image: Goldman Sachs Global Investment Research
S&P Sector Valuation Dashboard The S&P energy sector still looks attractive. Image: Goldman Sachs Global Investment Research
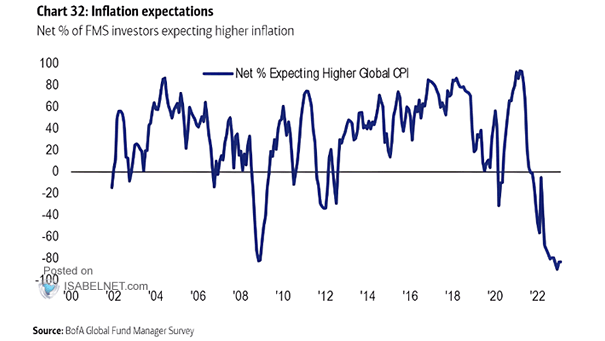
Inflation – Net % Expecting Higher Global CPI Almost all FMS investors expect inflation rates to fall. Image: BofA Global Fund Manager Survey
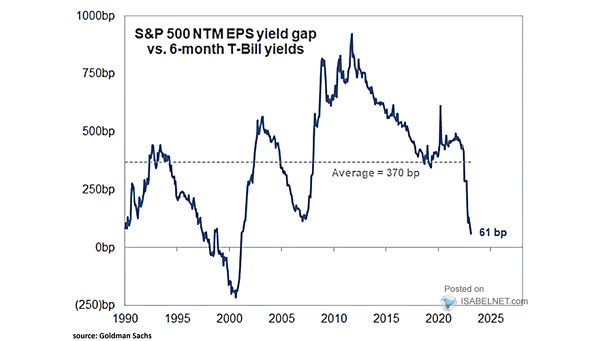
S&P 500 NTM EPS Yield Gap vs. 6-Month T-Bill Yields Cash is becoming an attractive option for investors. Image: Goldman Sachs Global Investment Research
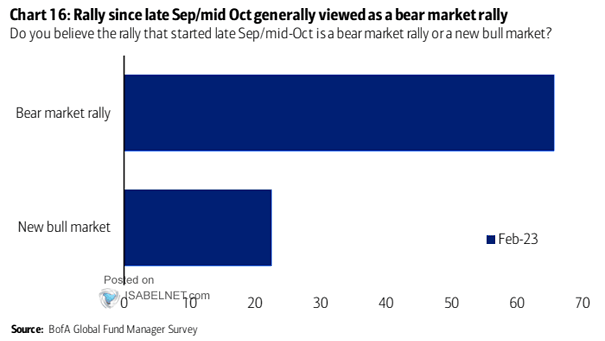
Bear Market Rally or New Bull Market? Most FMS investors do not think this is a new bull market. Image: BofA Global Fund Manager Survey
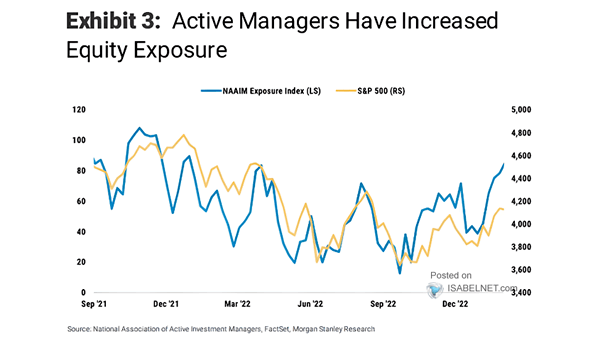
Sentiment – S&P 500 vs. NAAIM Exposure Index Active investment managers are chasing price. Are they too optimistic? Image: Morgan Stanley Research
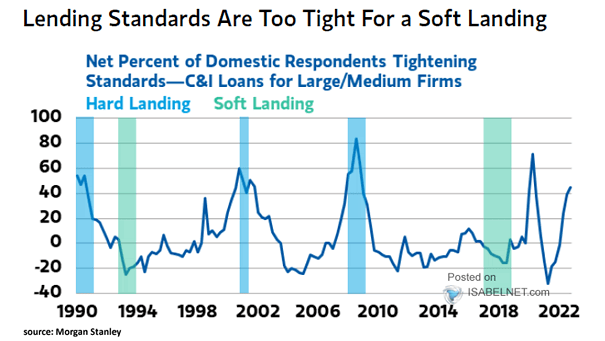
Net Percent of Domestic Respondents Tightening Standards Lending standards are way too tight. Bye-bye soft landing? Image: Morgan Stanley Wealth Management
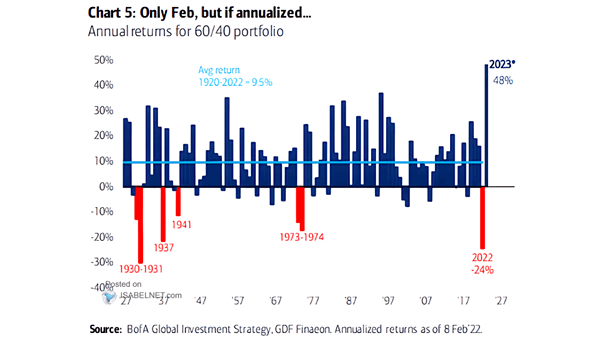
Annual 60/40 Portfolio Performance Will the 60/40 portfolio continue to perform well in 2023? Image: BofA Global Investment Strategy
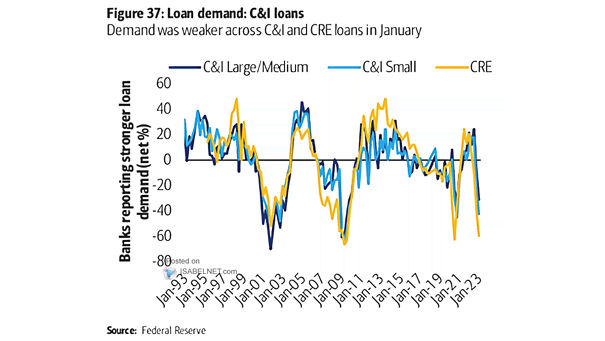
Loan Demand Demand for commercial & industrial (C&I) and commercial real estate (CRE) loans remains weak, which does not bode well for a soft landing. Image: BofA Global Research
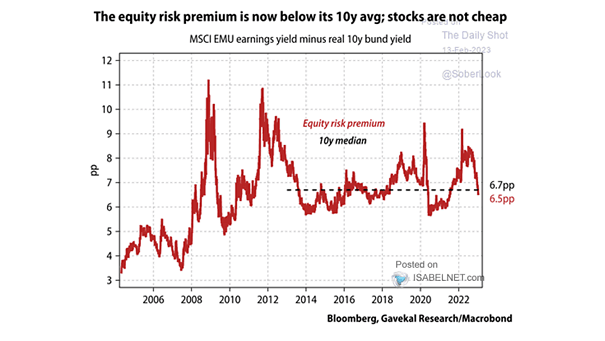
Stocks – MSCI EMU Earnings Yield Minus Real 10-Year Bund Yield (Equity Risk Premium) The equity risk premium below its 10-year average does not bode well for eurozone stocks. Image: Gavekal, Macrobond
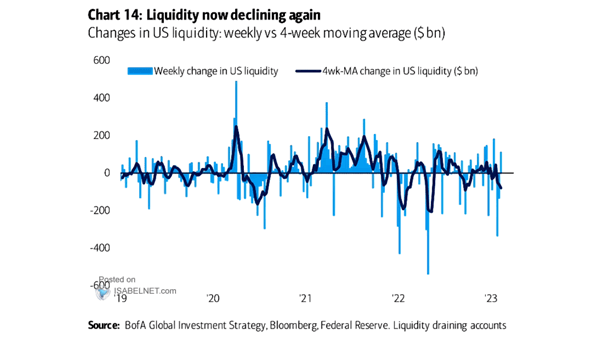
Changes in U.S. Liquidity U.S. liquidity is declining, which is a headwind for U.S. stocks. Image: BofA Global Investment Strategy
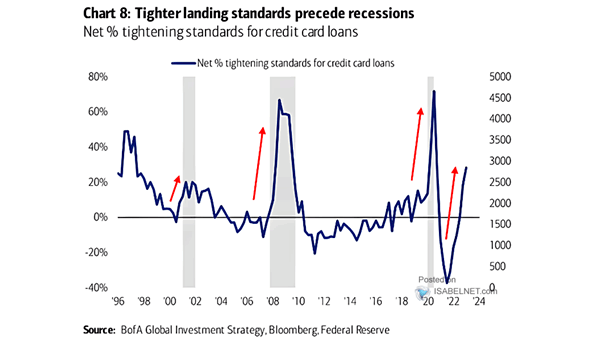
U.S. Recession – Net % Tightening Standards for Credit Card Loans U.S. banks are concerned about the risk of a recession, as they are tightening their lending standards. Image: BofA Global Investment Strategy