Average S&P 500 Returns Around Recessionary Bear Markets
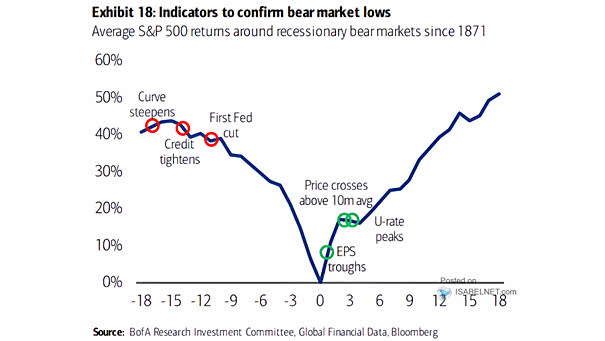
Average S&P 500 Returns Around Recessionary Bear Markets There are several indicators that can be used to confirm recessionary bear market lows. Image: BofA Research Investment Committee
Average S&P 500 Returns Around Recessionary Bear Markets There are several indicators that can be used to confirm recessionary bear market lows. Image: BofA Research Investment Committee
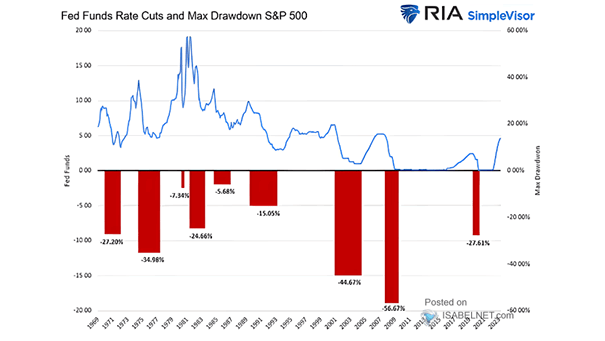
Fed Funds Rate Cuts and Max Drawdown S&P 500 Historically, Fed rate cuts are not bullish for the S&P 500. Image: Real Investment Advice
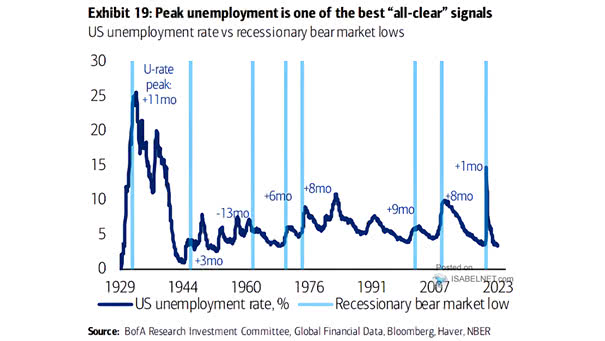
U.S. Unemployment Rate vs. Recessionary Bear Market Lows The peak in unemployment can be used as a signal for the end of a recessionary bear market in U.S. stocks. Image: BofA Research Investment Committee
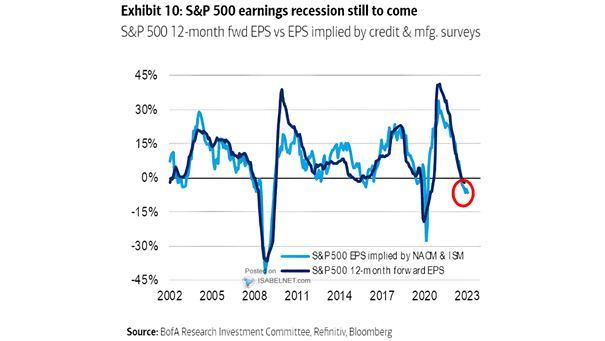
Earnings – S&P 500 12-Month Fwd EPS vs. EPS Implied by Credit and Manufacturing Surveys Could an earnings recession be a significant risk for U.S. stocks? Image: BofA Research Investment Committee

S&P 500 Price Returns Based on U.S. ISM Manufacturing PMI Levels The U.S. ISM Manufacturing PMI between 45 and 50 is historically bullish for U.S. stocks over the next 12 months. Image: MarketDesk Research
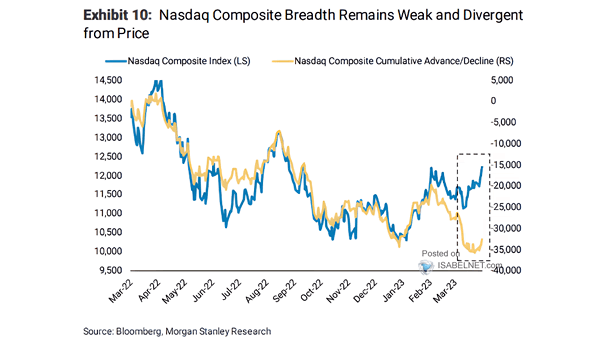
Nasdaq Composite Index vs. Nasdaq Composite Cumulative Advance/Decline The Nasdaq Composite’s breadth is not great. Image: Morgan Stanley Research
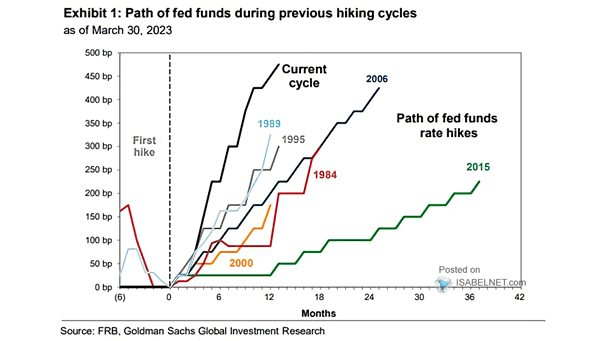
Path of Fed Funds During Previous Hiking Cycles The Fed has been particularly aggressive in raising rates to fight inflation compared to previous hiking cycles. Image: Goldman Sachs Global Investment Research
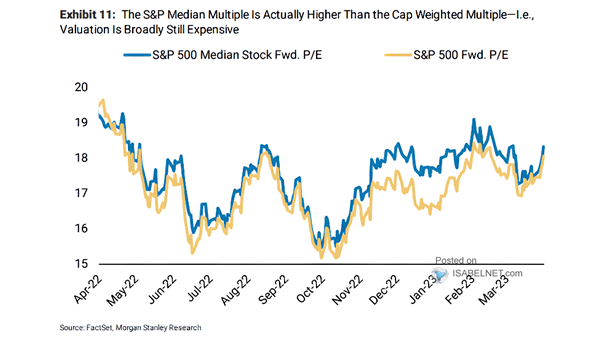
Valuation – S&P 500 Median Stock Forward P/E and S&P 500 Forward P/E The valuation of the S&P 500 remains at lofty levels. Image: Morgan Stanley Research
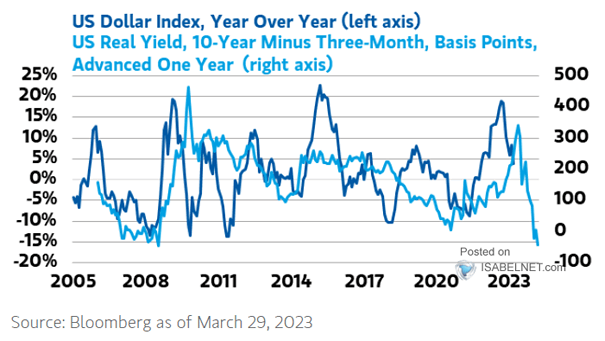
U.S. Dollar Index vs. 10Y-3M Real U.S. Treasury Yield Curve (Leading Indicator) The real U.S. yield curve suggests that the U.S. dollar may weaken over the next 12 months. Image: Morgan Stanley Wealth Management
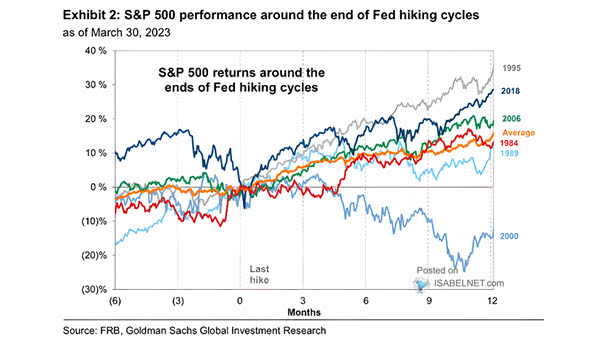
S&P 500 Returns Around the End of Fed Hiking Cycles In recent history, U.S. stocks tend to rally if there is no recession following the end of Fed hiking cycles. Image: Goldman Sachs Global Investment…
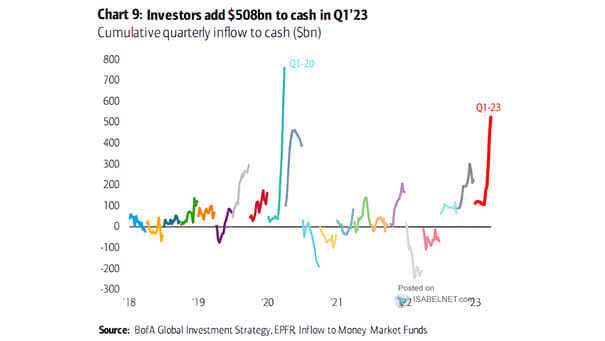
Cumulative Quarterly Inflow to Cash Cash is making a strong comeback as interest rates rise. Image: BofA Global Investment Strategy