Sentiment – Consecutive Weeks of Negative Bull-Bear Spread
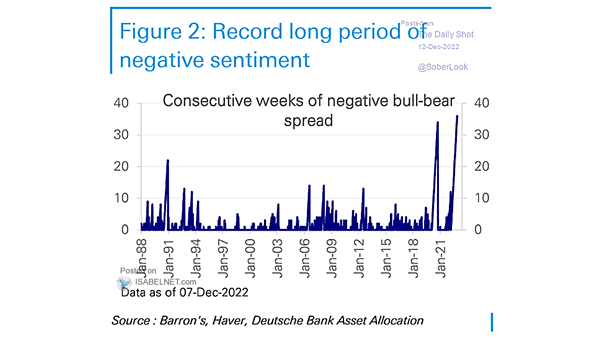
Sentiment – Consecutive Weeks of Negative Bull-Bear Spread Negative sentiment persists among investors. Image: Deutsche Bank Asset Allocation
Sentiment – Consecutive Weeks of Negative Bull-Bear Spread Negative sentiment persists among investors. Image: Deutsche Bank Asset Allocation
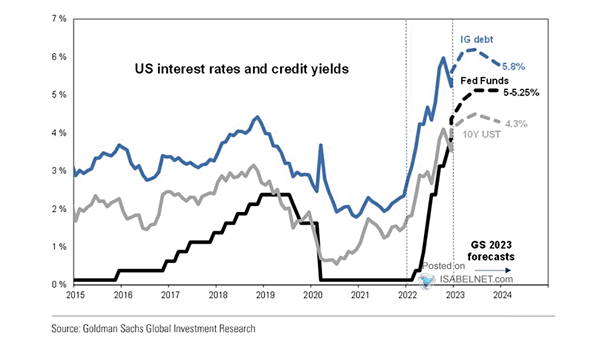
U.S. Interest Rates and Credit Yields Will U.S. interest rates continue to rise in 2023? Image: Goldman Sachs Global Investment Research
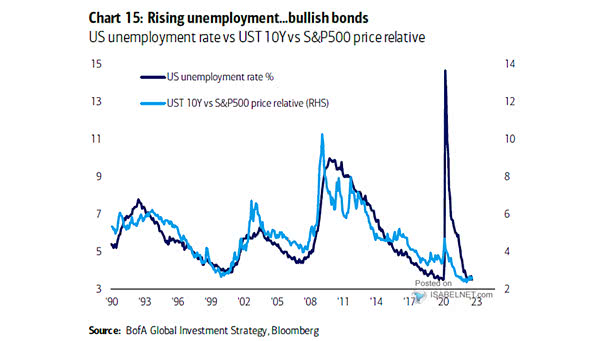
Performance – U.S. Unemployment Rate vs. UST 10-Year vs. S&P 500 Price Relative Bonds tend to outperform stocks in a recessionary labor market. Image: BofA Global Investment Strategy
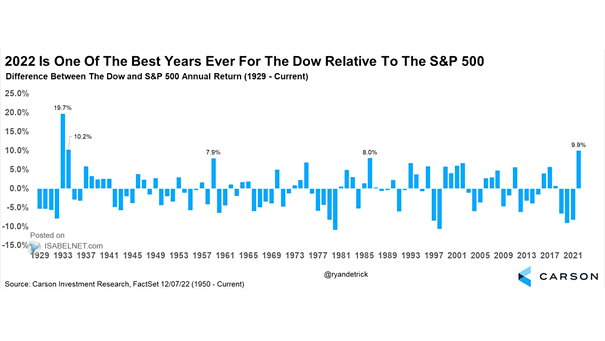
Difference Between the Dow and S&P 500 Annual Return Will the Dow continue to outperform the S&P 500 in 2023? Image: Carson Investment Research
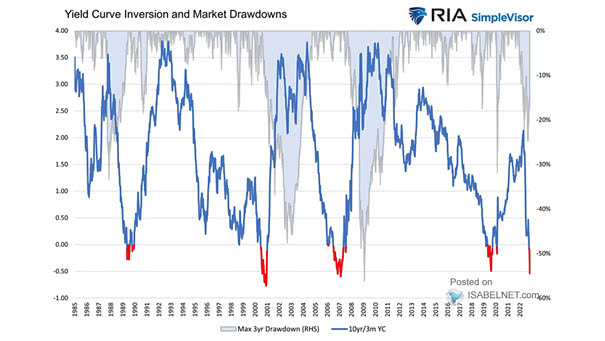
U.S. Yield Curve Inversion and Market Drawdowns The U.S. stock market is expected to bottom out well after the 10Y-3M yield curve un-inverts. Image: Real Investment Advice
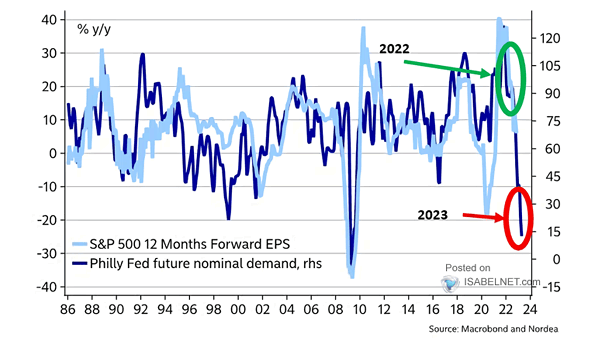
Philly Fed Future Nominal Orders vs. S&P 500 12-Months Forward EPS (Leading Indicator) A severe contraction in earnings growth should hurt U.S. stocks in 2023. Image: Nordea and Macrobond
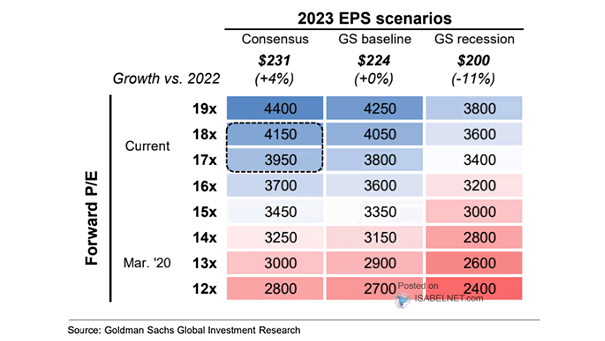
S&P 500 Price Based on EPS and P/E Scenario According to Goldman Sachs, the S&P 500 Index could fall to 3150 in the event of a U.S. recession. Image: Goldman Sachs Global Investment Research
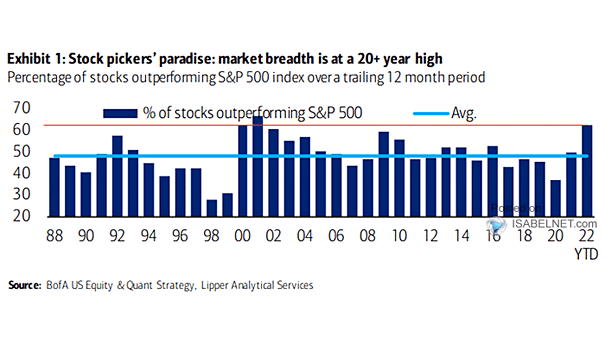
Percentage of Stocks Outperforming the S&P 500 Index This year is a great market for stock pickers. Image: BofA US Equity & Quant Strategy
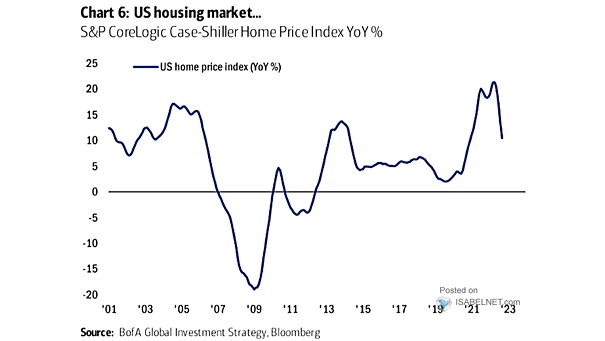
S&P CoreLogic Case-Shiller Home Price Index How far will U.S. home prices fall as rates rise? Image: BofA Global Investment Strategy
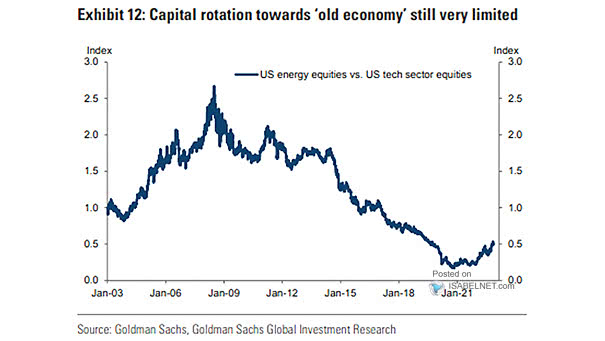
U.S. Energy Equities vs. U.S. Tech Sector Equities Should investors continue to overweight U.S. energy equities? Image: Goldman Sachs Global Investment Research
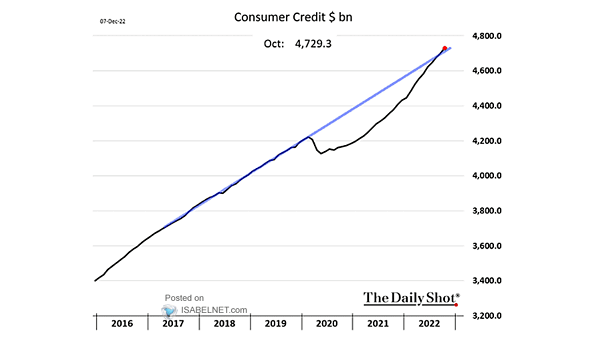
U.S. Consumer Credit U.S. consumer borrowing is growing fast as goods prices continue to increase. Image: The Daily Shot