Global Equities – 50-Day Moving Average Breadth
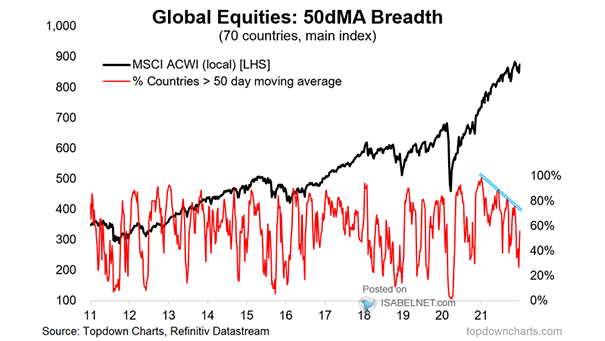
Global Equities – 50-Day Moving Average Breadth Global equities breadth has worsened significantly since the beginning the year. Image: Topdown Charts
Global Equities – 50-Day Moving Average Breadth Global equities breadth has worsened significantly since the beginning the year. Image: Topdown Charts
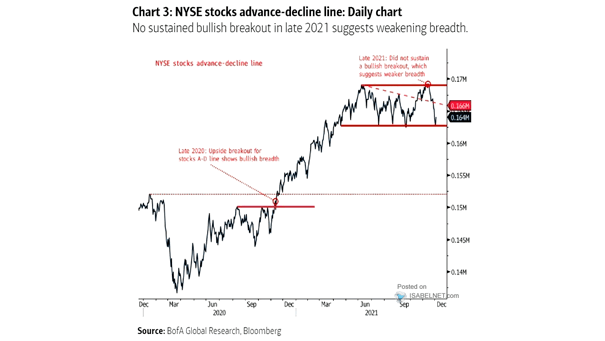
NYSE Stocks Advance-Decline Line The NYSE stocks advance-decline line did not sustain a bullish breakout in late 2021, which suggests weaker breadth. Image: BofA Global Research
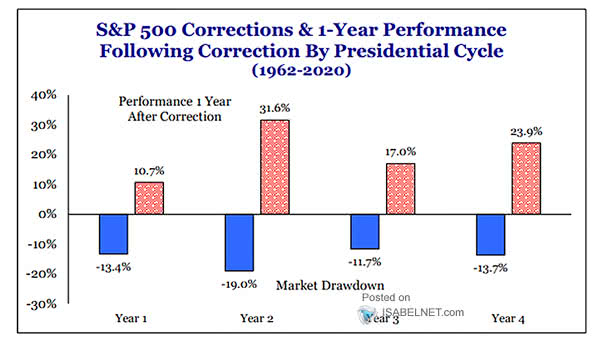
S&P 500 Corrections and 1-Year Performance Following Correction by Presidential Cycle Is the S&P 500 headed for a big correction in 2022? Image: Strategas Research Partners
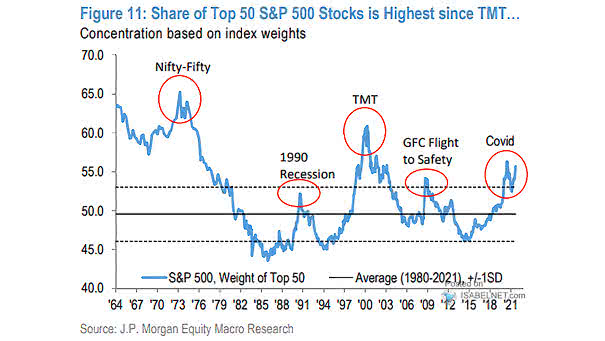
S&P 500 – Weight of Top 50 Is it a bull trap? The S&P 500 remains very concentrated in the top 50 stocks. Image: J.P. Morgan Equity Macro Research
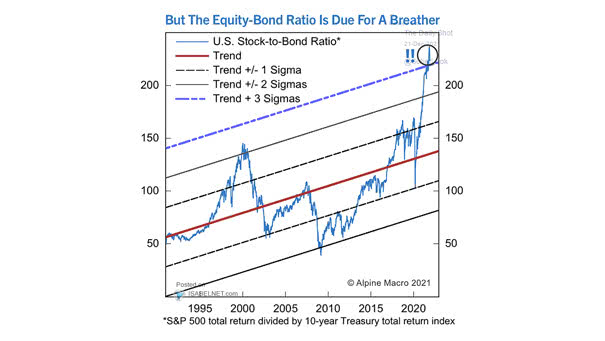
Returns – U.S. Stock-to-Bond Ratio Should U.S. equity investors be worried that the U.S. stock-to-bond ratio is at an extreme level? Image: Alpine Macro
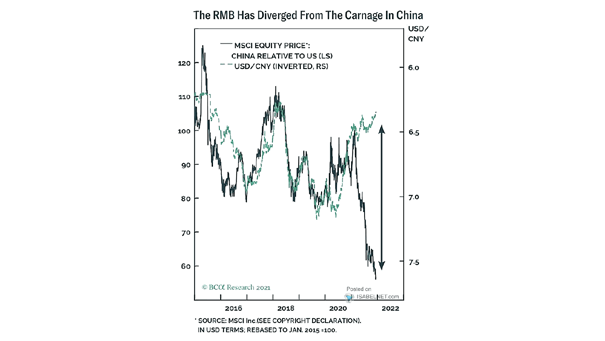
MSCI Equity Price: China Relative to U.S. and USD/CNY (Inverted) The RMB should weaken relative to the U.S. dollar. Image: BCA Research

Expensive Stocks and Fed Balance Sheet Are expensive stocks vulnerable to Fed tapering in 2022? Image: Morgan Stanley Research
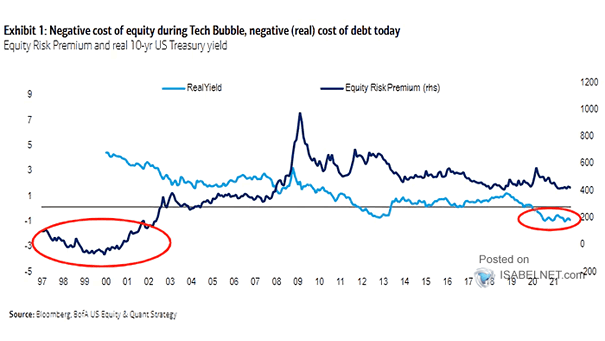
Markets – Equity Risk Premium and Real 10-Year U.S. Treasury Yield The similarities between today and the tech bubble make BofA bearish on 2022. Image: BofA US Equity & Quant Strategy
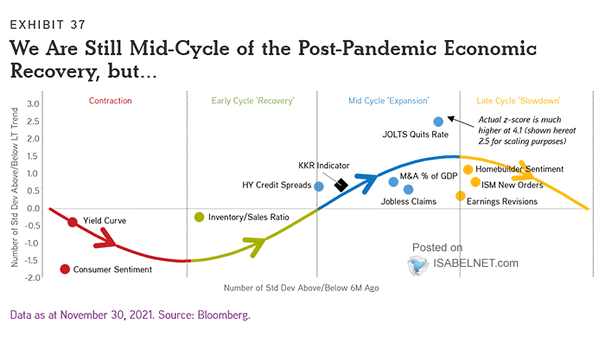
U.S. Cycle Indicator The KKR’s U.S. cycle indicator from KKR is still in the mid-cycle expansion phase. Image: KKR & Co.
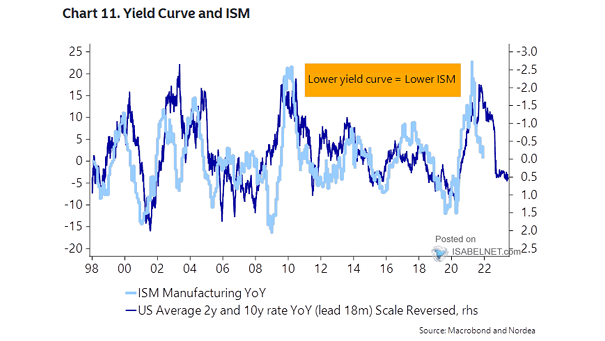
ISM YoY and U.S. 2+10-Year Bond Yield YoY (Leading Indicator) The U.S. 2+10-year bond yield YoY (inverted) tends to lead the ISM YoY by 18 months, suggesting that the growth momentum is expected to fade…
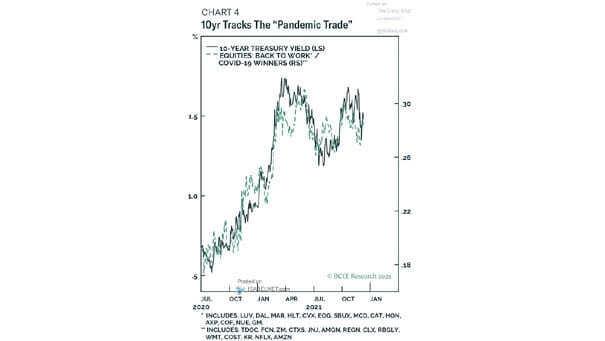
U.S. 10-Year Treasury Yield and Equities: Back to Work / COVID-19 Winners The U.S. 10-year Treasury yield tends to track the pandemic trade. Image: BCA Research