Euro to U.S. Dollar (EUR/USD) and China Credit Impulse – Leading Indicator
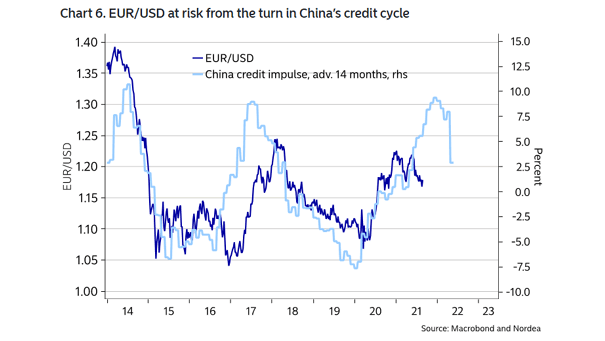
Euro to U.S. Dollar (EUR/USD) and China Credit Impulse – Leading Indicator China credit impulse tends to lead EUR/USD by 14 months. Image: Nordea and Macrobond
Euro to U.S. Dollar (EUR/USD) and China Credit Impulse – Leading Indicator China credit impulse tends to lead EUR/USD by 14 months. Image: Nordea and Macrobond
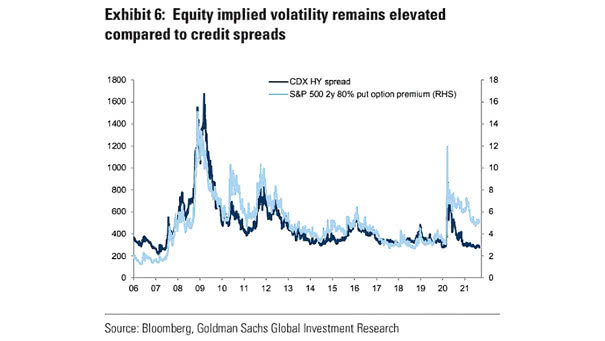
U.S. Equity Implied Volatility and Credit High Yield Spreads U.S. equity implied volatility remains at relatively high levels. Image: Goldman Sachs Global Investment Research

Consensus U.S. 10-Year Bond Yield Forecast The consensus forecast for U.S. 10-year bond yields is 1.9% by year-end. Image: BofA Global Investment Strategy
S&P 500 Buyback Index Stock buybacks continue to increase which is good news for U.S. stocks. Image: TS Lombard
S&P 500 with Moving Averages Will the S&P 500 soon reach 4,615? Image: BofA Global Research
Small Cap Stocks – Percentage of Russell 2000 Stocks Above 50-Day Moving Averages Will small-cap stocks rally again? Image: BofA Global Research
S&P 500 – Number of Closing Highs Will the S&P 500 break the all-time record of 77 new highs this year? Image: S&P 500 Dow Jones Indices
Seasonality – U.S. Treasury Market Historically, the U.S. Treasury market tends to fade into the fall. Image: J.P. Morgan
Reflation Trade Positioning Indicator Is the reflation trade over? Image: Topdown Charts
S&P 500 6-Month Seasonal Returns and Percentage of Time Up – Presidential Cycle Year 1 into Presidential Cycle Year 2 From Presidential cycle year 1 into Presidential cycle year 2, the S&P 500 has historically…
G3 Credit Impulse and Commodities (Leading Indicator) G3 credit impulse tends to lead commodity prices by 12 months. Image: Nordea and Macrobond