S&P 500 vs. Fed Fund Rates and Real GDP
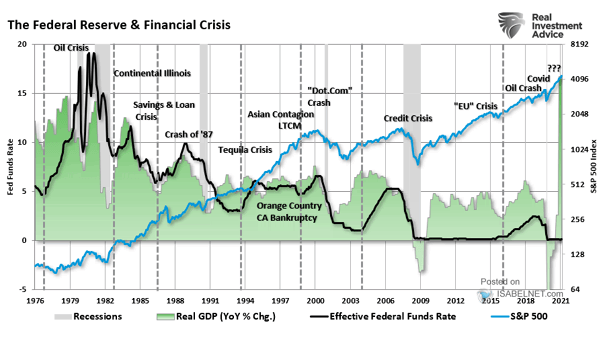
S&P 500 vs. Fed Fund Rates and Real GDP Equity markets are vulnerable to tapering and rising rates. Could the Fed be making a policy mistake? Image: Real Investment Advice
S&P 500 vs. Fed Fund Rates and Real GDP Equity markets are vulnerable to tapering and rising rates. Could the Fed be making a policy mistake? Image: Real Investment Advice
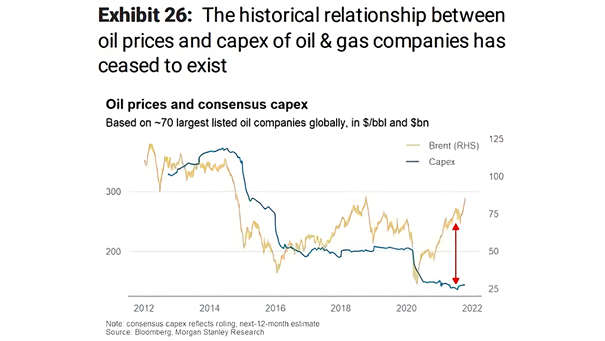
Oil Prices and Consensus Capex Could oil capex cuts lead to supply disruptions? Image: Morgan Stanley Research
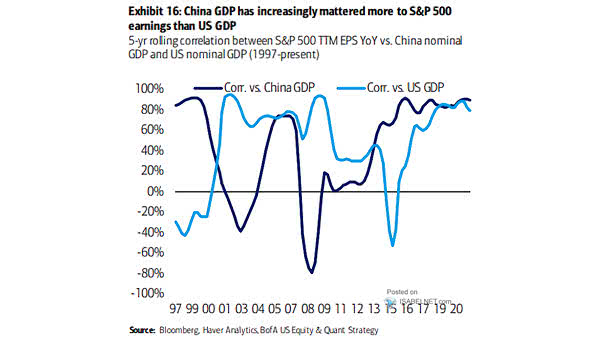
5-Year Rolling Correlation Between S&P 500 TTM EPS YoY vs. China Nominal GDP and U.S. Nominal GDP China’s economic growth slowdown suggests trouble ahead for the S&P 500. Image: BofA US Equity & Quant Strategy
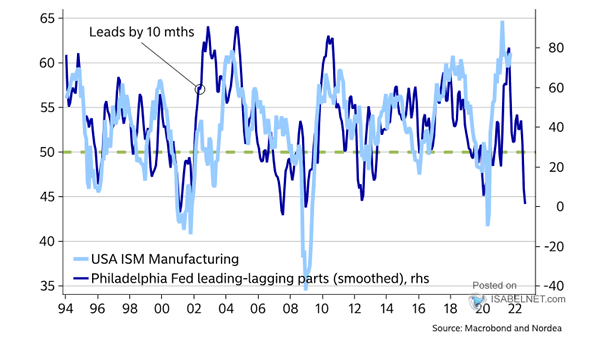
U.S. ISM Manufacturing vs. Philadelphia Fed Leading-Lagging Parts – Leading Indicator Philadelphia Fed leading vs. lagging variables tend to lead U.S. ISM Manufacturing by 10 months. Image: Nordea and Macrobond
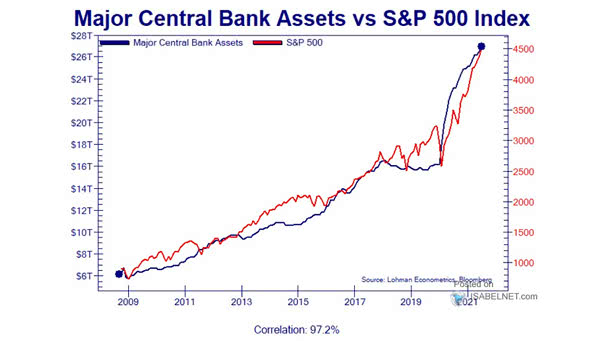
Major Central Bank Assets vs. S&P 500 Index The expansion of central bank balance sheets tends to push the S&P 500 Index higher. Is the sky the limit? Image: Lohman Econometrics

Inflation – CAPE Valuation vs. CPI Historically, valuations for the S&P 500 have been highest when CPI is between 1% to 4%. Image: Real Investment Advice
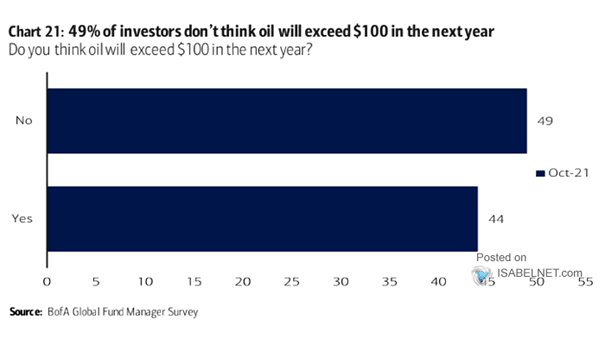
Survey – Do You Think Oil Will Exceed $100 in the Next Year? 49% of investors think oil will not exceed $100 in the next year. Image: BofA Global Fund Manager Survey
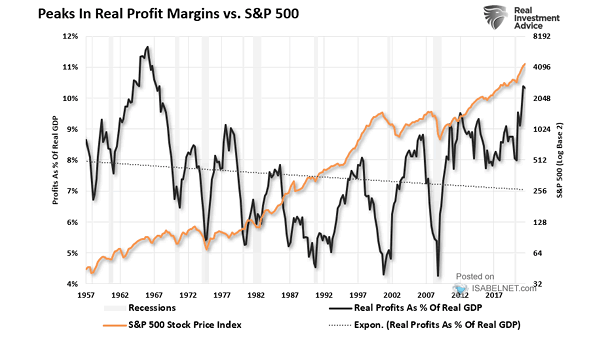
S&P 500 vs. Peaks in Real Profit Margins When will the S&P 500 fall? Keep an eye on real profit margins. Image: Real Investment Advice
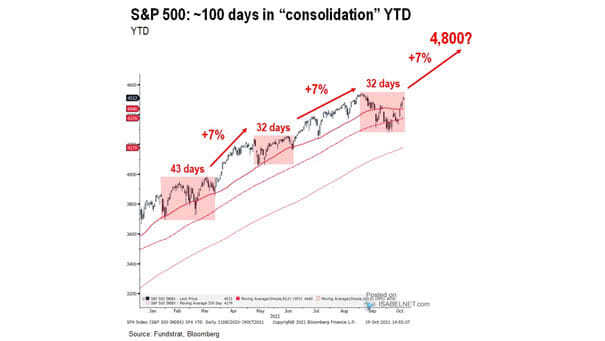
S&P 500 – 100 Days in “Consolidation” YTD Could a risk-on rally lead the S&P 500 to 4,800 by the end of the year? Image: Fundstrat Global Advisors, LLC
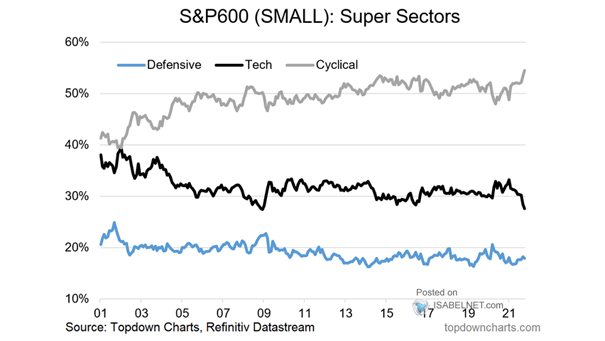
U.S. Small Cap Stocks – S&P 600 Super Sectors Will U.S. cyclicals continue to outperform tech stocks as rates rise? Image: Topdown Charts
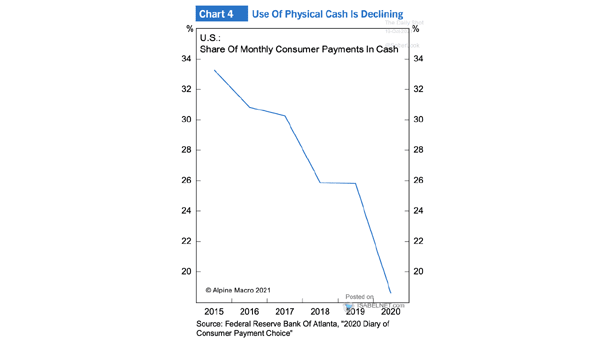
Share of Monthly Consumer Payments in Cash in the U.S. The coronavirus pandemic has accelerated the decline in cash payments in the United States. Image: Alpine Macro