S&P 500 Valuation Dispersion on Forward P/E
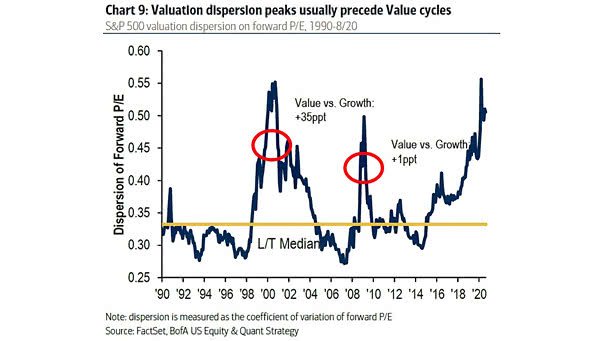
S&P 500 Valuation Dispersion on Forward P/E When valuation dispersion was this high, value stocks tended to outperform growth stocks. Image: BofA US Equity & Quant Strategy
S&P 500 Valuation Dispersion on Forward P/E When valuation dispersion was this high, value stocks tended to outperform growth stocks. Image: BofA US Equity & Quant Strategy
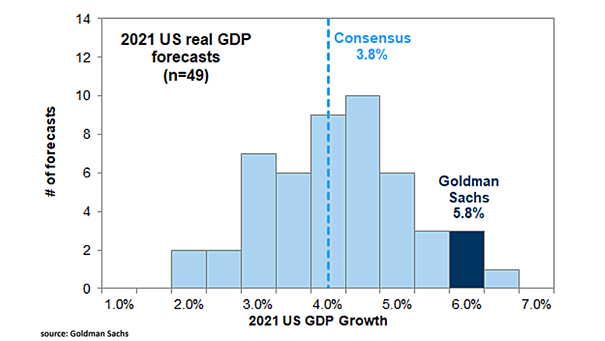
2021 U.S. Real GDP Forecasts Goldman Sachs forecasts U.S. real GDP growth of 5.8% in 2021 compared to the consensus forecast of 3.8%. Image: Goldman Sachs Global Investment Research
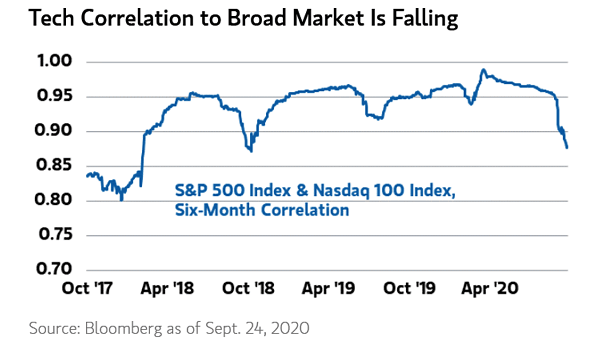
S&P 500 Index and Nasdaq 100 Index, Six-Month Correlation The Nasdaq 100 Index correlation to the S&P 500 Index is falling. Image: Morgan Stanley Wealth Management
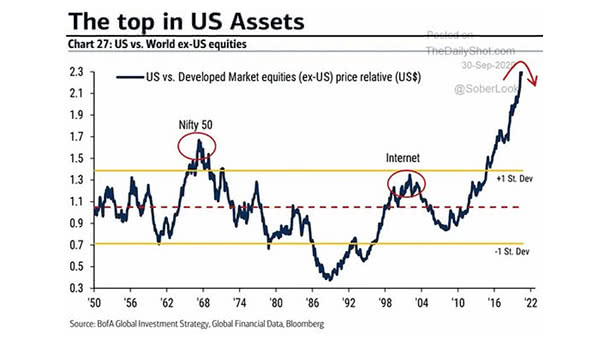
U.S. vs. World ex-U.S. Equities Is it a major turning point for the U.S. stock market? Image: BofA Global Investment Strategy
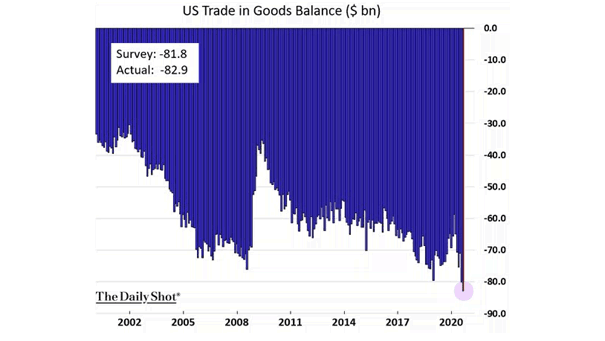
U.S. Trade in Goods Balance The U.S. deficit in trade of goods widened, as many businesses have shuttered due to the coronavirus pandemic. Image: The Daily Shot
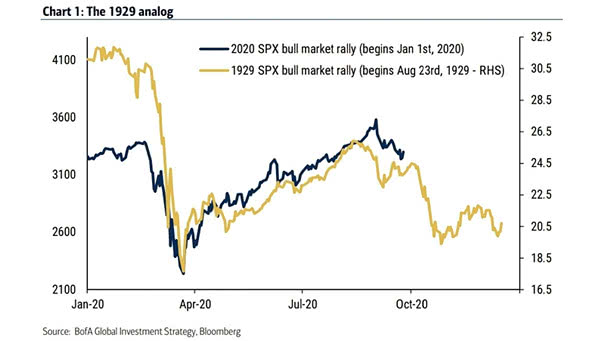
S&P 500 Bull Market Rally – 1929 vs. 2020 Should investors expect a market similar to that of 1929 going forward? Image: BofA Global Investment Strategy
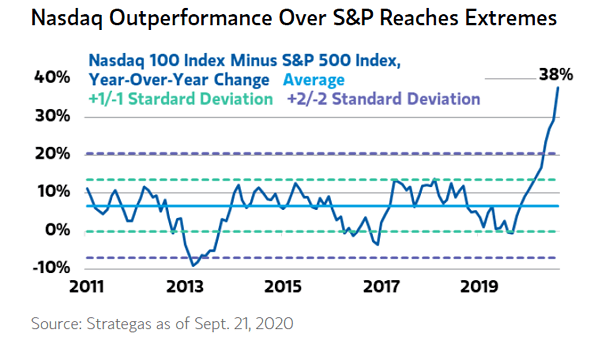
Nasdaq Outperformance Over S&P 500 Will the Nasdaq continue to outperform the S&P 500? Image: Morgan Stanley Wealth Management
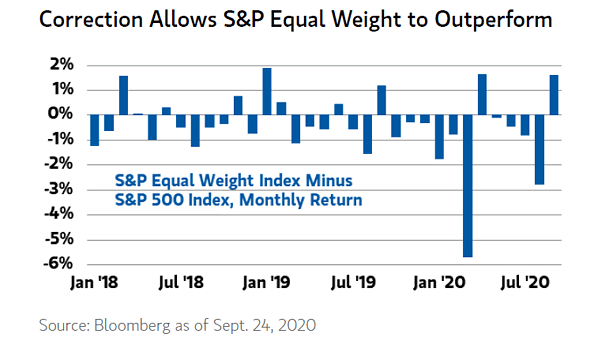
S&P 500 Equal Weight Index Minus S&P 500 Index The S&P 500 Equal Weight Index is expected to outperform the S&P 500 Index in the recovery phase. Image: Morgan Stanley Wealth Management
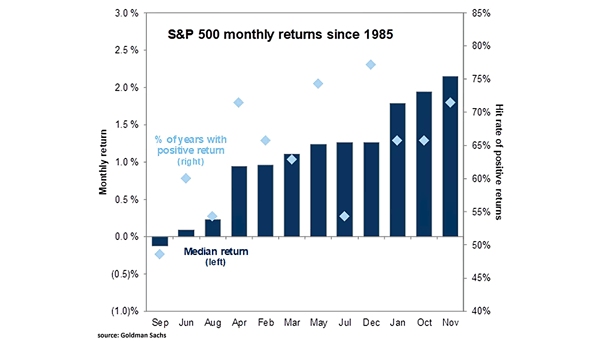
S&P 500 Monthly Returns Since 1985 More gains to come in Q4? Image: Goldman Sachs Global Investment Research
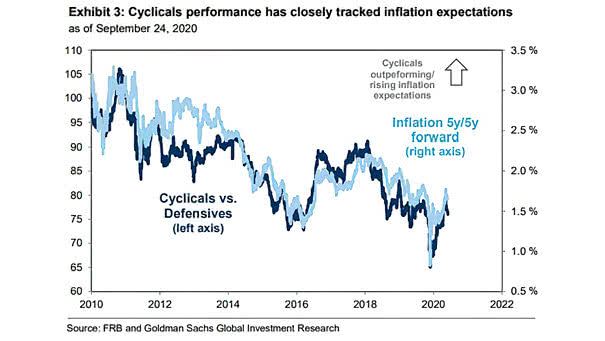
Cyclicals vs. Defensives and Inflation 5y/5y Forward Cyclicals tend to outperform when inflation expectations rise. Image: Goldman Sachs Global Investment Research
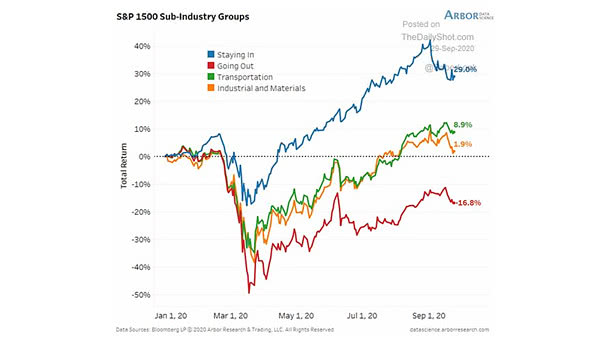
Performance – S&P 1500 Sub-Industry Groups Will the COVID-19 “Staying In” continue to outperform the COVID-19 “Going Out?” Image: Arbor Research & Trading LLC