Volatility – Nasdaq 3-Day Sigma Move
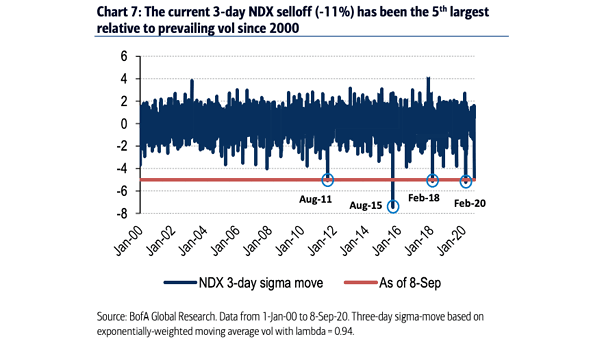
Volatility – Nasdaq 3-Day Sigma Move Is the selloff over for now? Image: BofA Global Research
Volatility – Nasdaq 3-Day Sigma Move Is the selloff over for now? Image: BofA Global Research
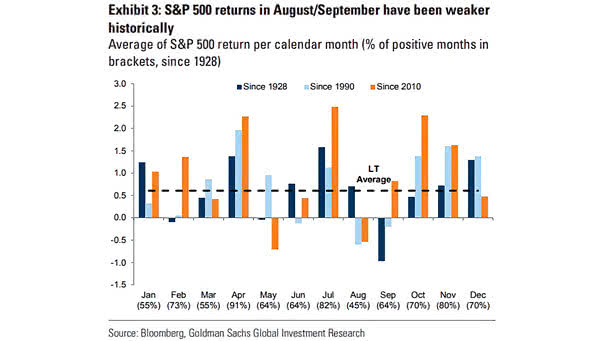
Seasonality – Average of S&P 500 Return Per Calendar Month Historically, August and September have been challenging for the S&P 500. Image: Goldman Sachs Global Investment Research
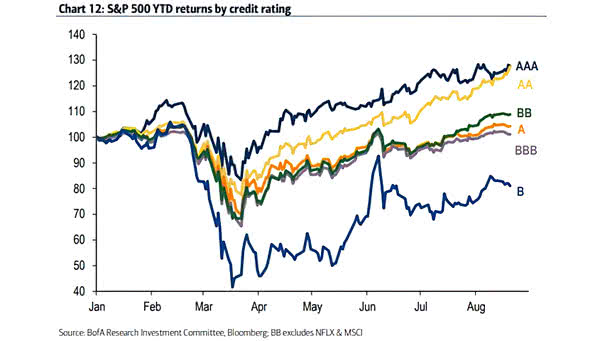
S&P 500 YTD Returns by Credit Rating Chart showing the impact of credit ratings on stock returns since the beginning of the year. Image: BofA Research Investment Committee
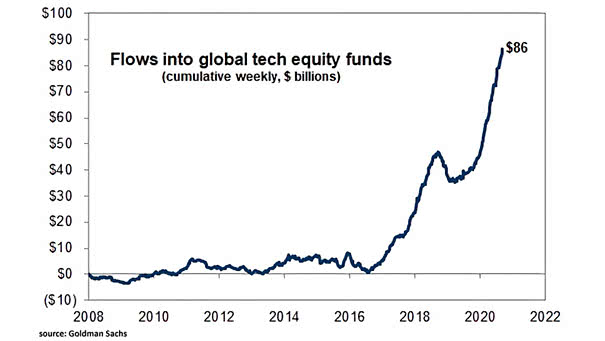
Flows into Global Tech Equity Funds Investors rush into tech, as they become more bullish. Image: Goldman Sachs Global Investment Research
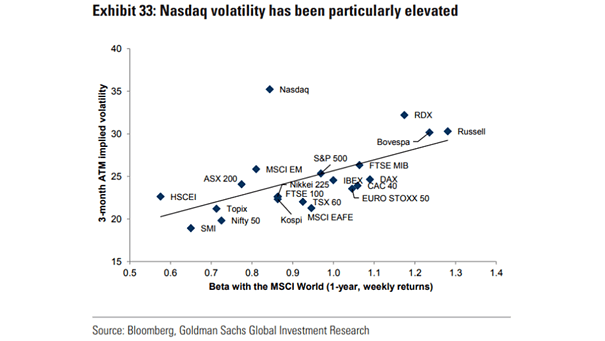
Nasdaq Volatility As the chart shows, the volatility of the Nasdaq has been particulary high. Image: Goldman Sachs Global Investment Research
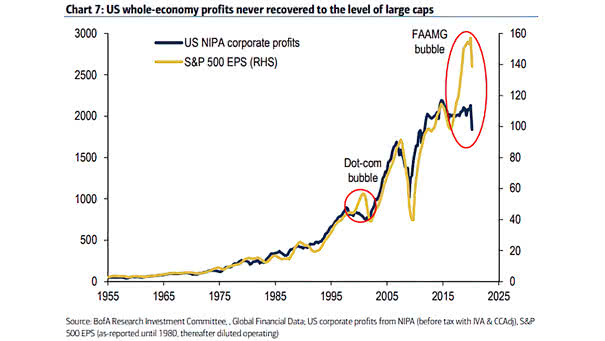
S&P 500 EPS vs. U.S. NIPA Corporate Profits This chart puts into perspective the wide divergence between S&P 500 EPS and U.S. NIPA corporate profits. Image: BofA Research Investment Committee
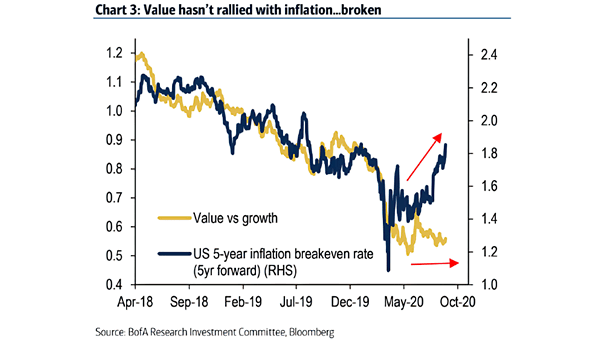
Value vs. Growth Stocks and U.S. 5-Year Inflation Breakeven Rate According to BofA, value stocks are broken after the worst performance relative to growth over a 10-year period. Image: BofA Research Investment Committee
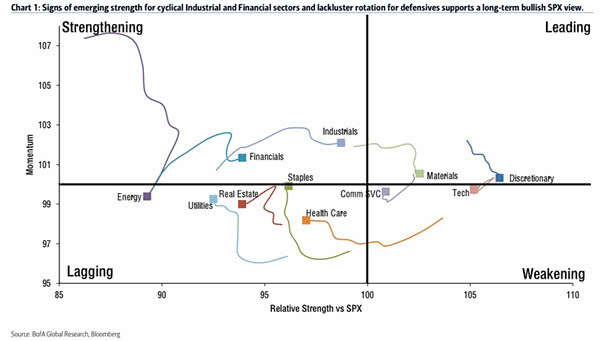
Long-Term Bullish S&P 500 View A view of sector rotation suggests a long-term bullish trend for the S&P 500. Image: BofA Global Research
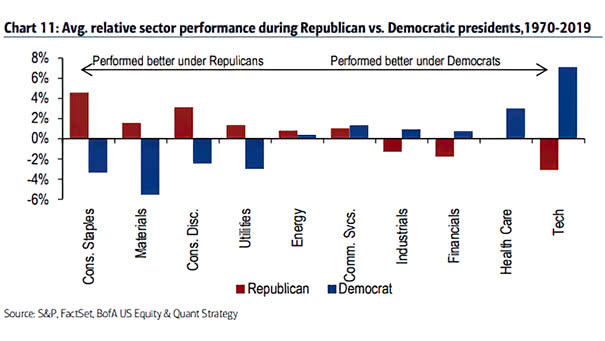
Average Relative Sector Performance During Republican vs. Democratic Presidents Tech has tended to outperform on average under a Democratic president. Image: BofA US Equity & Quant Strategy
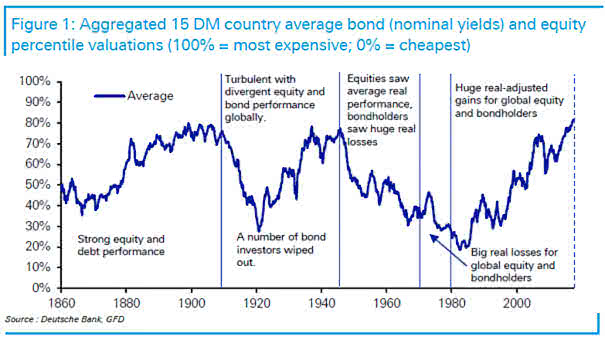
Aggregated 15 DM Country Average Bond and Equity Percentile Valuations As the chart suggests, this is the most expensive time to buy stocks and bonds. Image: Deutsche Bank

S&P 500 Equally-Weighted / S&P 500 Will the S&P Equal Weight Index outperform the S&P 500 Index in the recovery phase? Image: Morgan Stanley Research