S&P 500 and % of Members with MACD Sell Signals
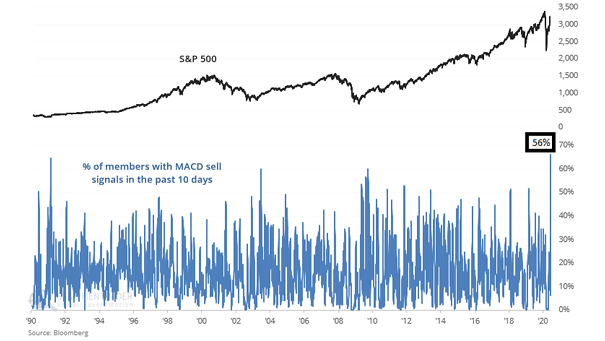
S&P 500 and % of Members with MACD Sell Signals Is that bearish? 56% of S&P 500 stocks are sending sell signals. Image: SentimenTrader
S&P 500 and % of Members with MACD Sell Signals Is that bearish? 56% of S&P 500 stocks are sending sell signals. Image: SentimenTrader
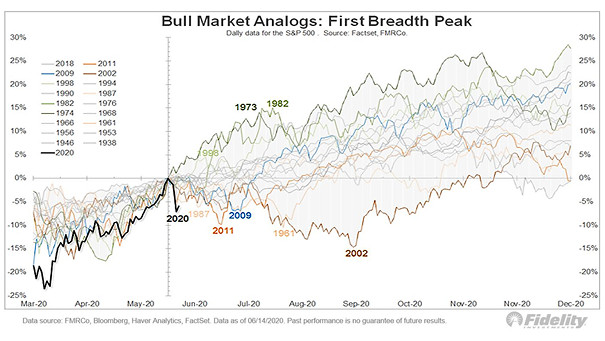
Bull Market Analogs and First Breadth Peak This chart shows the S&P 500 after it reaches that first breadth peak following a major decline. Image: Fidelity Investments
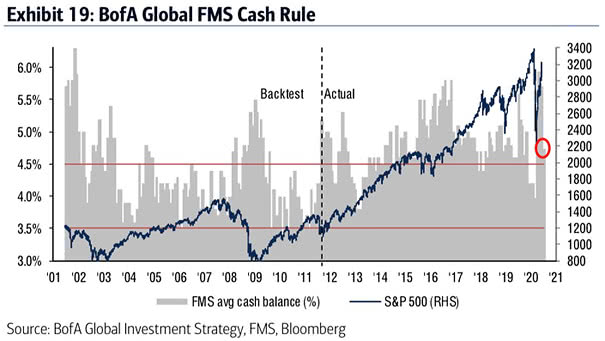
S&P 500 vs. FMS Cash Balance The BofA Fund Manager Survey cash balance is still elevated at 5.7%. This is an interesting contrarian indicator. Image: BofA Global FMS
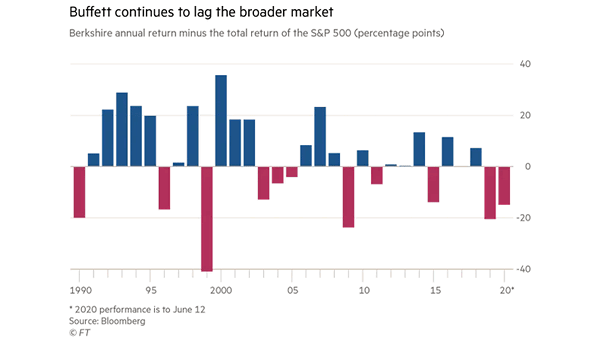
Berkshire Hathaway Annual Return Minus the Total Return of the S&P 500 Heavy on banks, but light on tech. Has Warren Buffett lost his mojo? Image: Financial Times
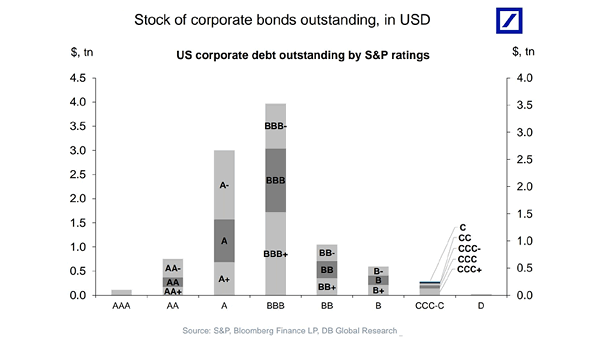
U.S. Corporate Debt Outstanding by S&P Ratings Should investors be worried? The proportion of BBB-rated bonds has increased significantly over time. Image: Deutsche Bank Global Research
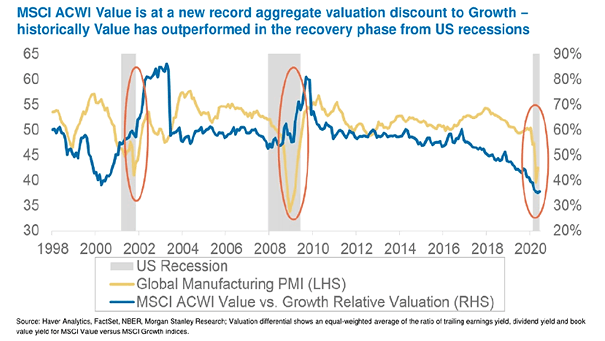
MSCI ACWI Value vs. Growth Relative Valuation and Global Manufacturing PMI Chart suggesting that value should outperform growth in the recovery phase. Image: Morgan Stanley Research
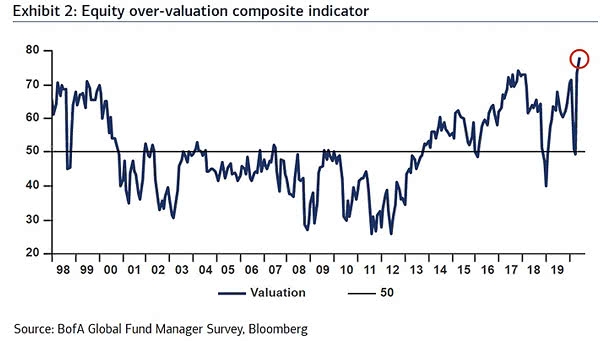
Equity Over-Valuation Composite Indicator Is the current stock market the most overvalued since 1998? 78% of FMS investors think so. Image: BofA Global Fund Manager Survey
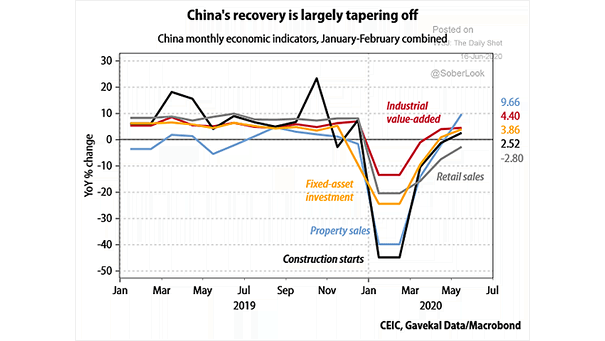
China Monthly Economic Indicators China recovery is far from complete, as demand remains weak. Image: Gavekal, Macrobond

Composite PMI Output Index Chart suggesting that the recovery looks V-shaped, so far. Image: Macrobond Financial
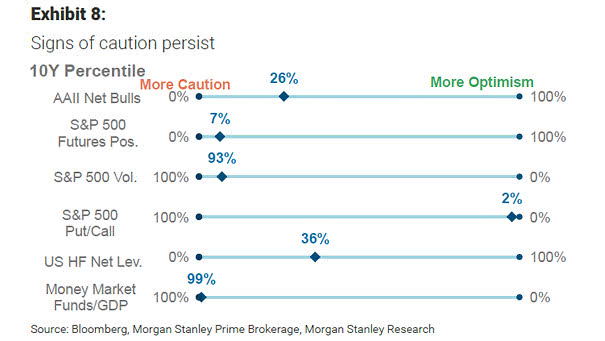
Sentiment Indicators Relative to their 10-Year Range Chart suggesting that investor sentiment and positioning look weak overall. Image: Morgan Stanley Research
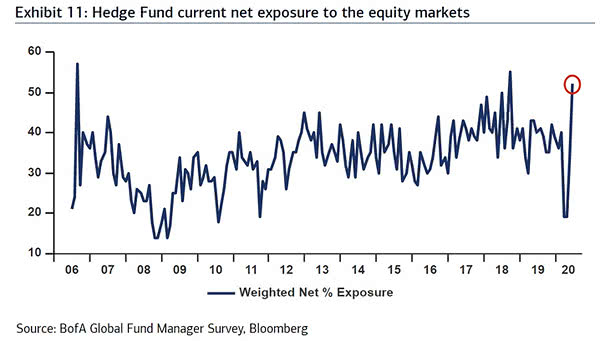
Hedge Fund Current Net Exposure to the Equity Markets Hedge fund net exposure to equities is now high relative to recent history. Image: BofA Global Fund Manager Survey