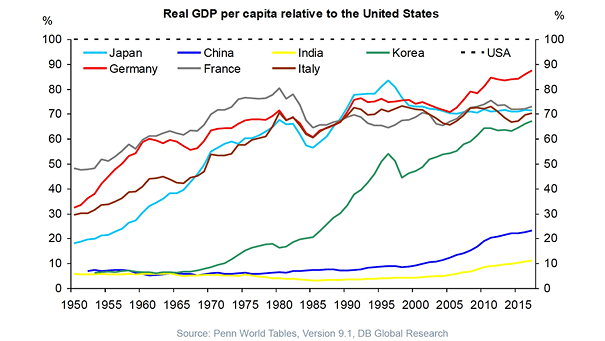
S&P 500 – 2020 vs. 2009

S&P 500 – 2020 vs. 2009 This chart suggests that the S&P 500 is following the 2009 pattern and market breadth. Image: Morgan Stanley Research

Size of Selected U.S. Asset Markets

Size of Selected U.S. Asset Markets This chart puts into perspective the size of selected U.S. asset markets. The U.S. stock market is more than twice as large as the U.S. Treasury market. Image: Deutsche…

S&P 500 Equity Risk Premium – 2020 vs. 2009

S&P 500 Equity Risk Premium – 2020 vs. 2009 Same equity risk premium in March 2020 as March 2009, but 30% higher P/E thanks to the level of rates. Image: Morgan Stanley Research

Secular Bull and Secular Bear Markets

Secular Bull and Secular Bear Markets This year could be similar to 1957 and 1987, suggesting that the secular bull market is still intact for the time being. Image: BofA Global Research

Market Sentiment (AAII)

Market Sentiment (AAII) Are AAII investors too bearish? The S&P 500 is up 30%, but there are now more bears than at the March lows. Image: Fidelity Investments

U.S. Retail Sales in March-April 2020

U.S. Retail Sales in March-April 2020 U.S. retail sales from March to April is dramatic and tumbled by a record 16.4%. Image: Oxford Economics

European IPOs

European IPOs This chart highlights the sharp slowdown in European IPO activity. Image: Financial Times