Bitcoin Market Price and Intrinsic Value
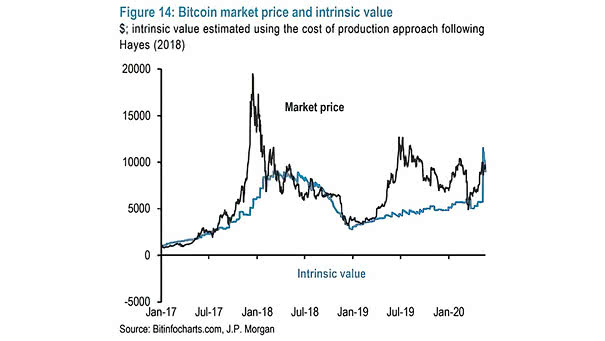
Bitcoin Market Price and Intrinsic Value This chart suggests Bitcoin’s intrinsic value using the cost of production approach following Hayes. Image: J.P. Morgan
Bitcoin Market Price and Intrinsic Value This chart suggests Bitcoin’s intrinsic value using the cost of production approach following Hayes. Image: J.P. Morgan
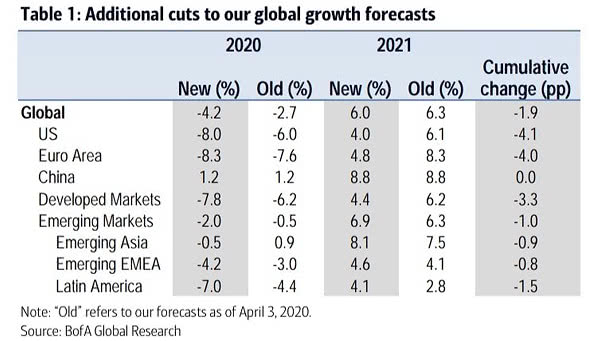
Global GDP Growth Forecasts BofA has revised lower 2020 GDP growth for 28 of 43 countries. Image: BofA Global Research
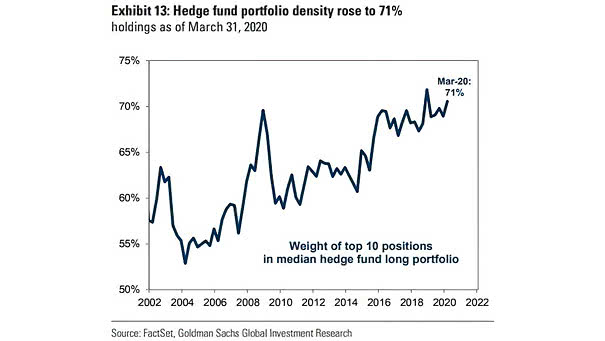
Weight of Top 10 Positions in Median Hedge Fund Long Portfolio The average hedge fund holds 71% of its long portfolio in its top 10 positions. This is one percentage point below the record high…
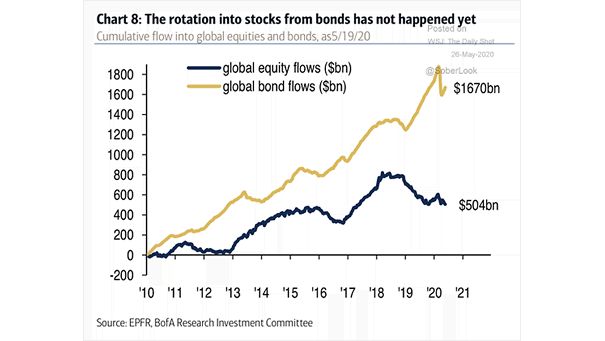
Cumulative Flow into Global Equities and Bonds So far, there is no sign of a great rotation into stocks from bonds. Image: BofA Research Investment Committee
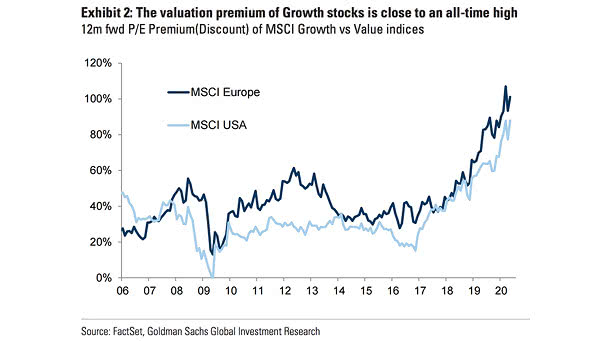
Valuation – P/E Premium of MSCI Growth vs. Value Indices The valuation premium of growth stocks vs. value stocks is close to an all-time high. Image: Goldman Sachs Global Investment Research
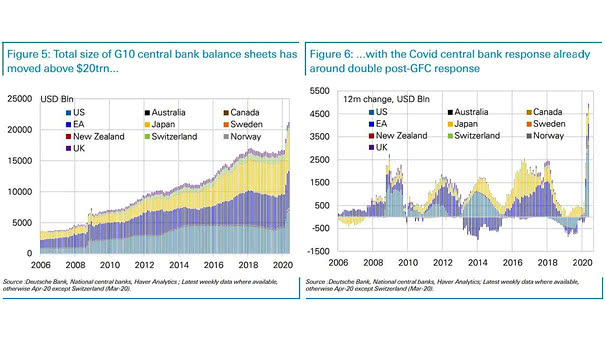
G10 Central Bank Balance Sheets The total size of G10 central bank balance sheets has now surpassed $20 trillion. Image: Deutsche Bank
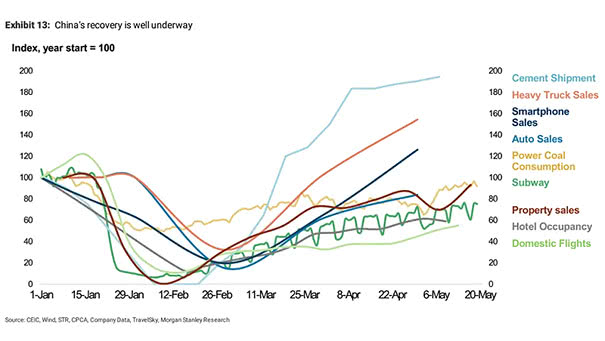
China Recovery China recovery is well underway, suggesting a quick economic recovery. Image: Morgan Stanley Research
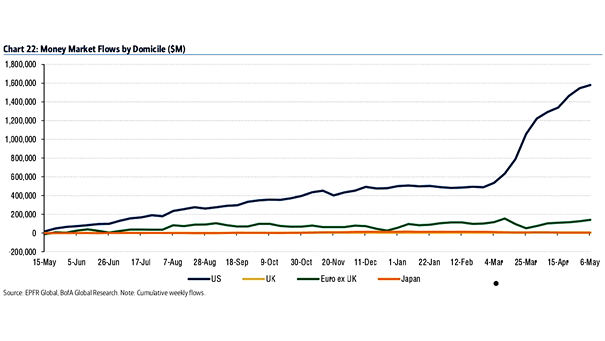
Cumulative Weekly Money Market Flows by Domicile Record money market flows in the United States, as the coronavirus pandemic leads to a flight to quality. Image: BofA Global Research
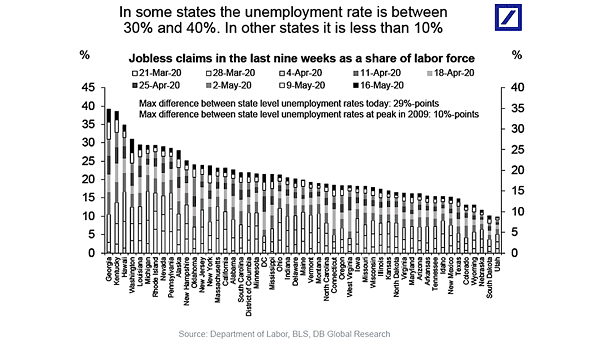
U.S. Unemployment Rate – Jobless Claims in the Last Nine Weeks as a Share of Labor Force This chart shows the wave of job losses in the United States. Image: Deutsche Bank Global Research
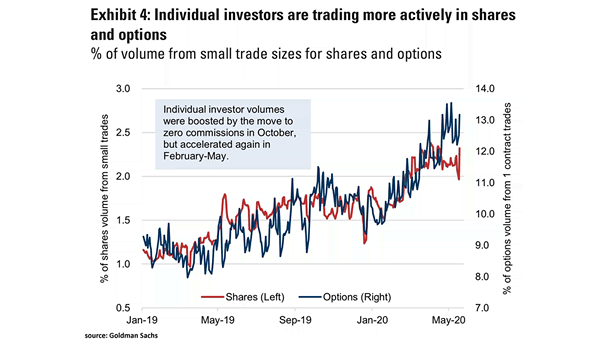
Individual Investors Are Trading More Actively in Shares and Options The move to zero commissions in October and the lockdowns boosted individual investor volumes. Image: Goldman Sachs Global Investment Research
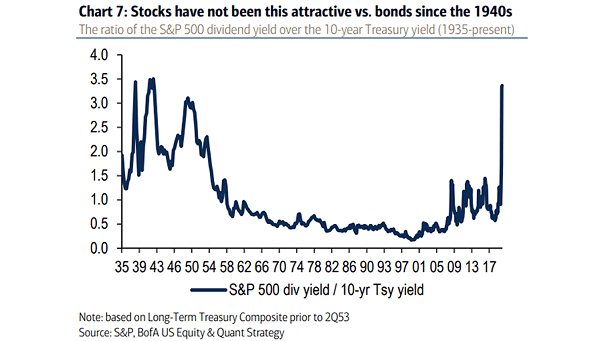
Ratio of the S&P 500 Dividend Yield over the 10-Year Treasury Yield Chart suggesting that stocks have not been this attractive relative to bonds since the 1940s. Image: BofA US Equity & Quant Strategy