Global Cumulative Weekly Flow: Fixed Income vs. Equities
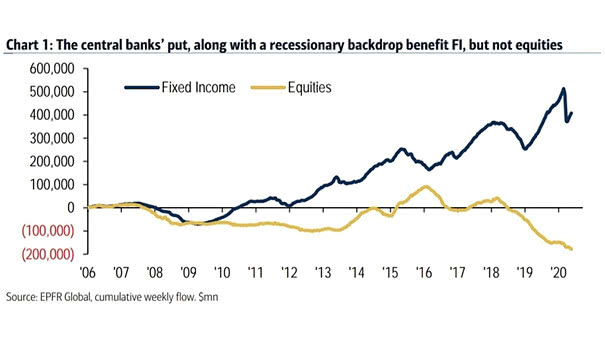
Global Cumulative Weekly Flow: Fixed Income vs. Equities This chart highlights once again investors’ strong preference for bonds. Image: BofA Global Research
Global Cumulative Weekly Flow: Fixed Income vs. Equities This chart highlights once again investors’ strong preference for bonds. Image: BofA Global Research
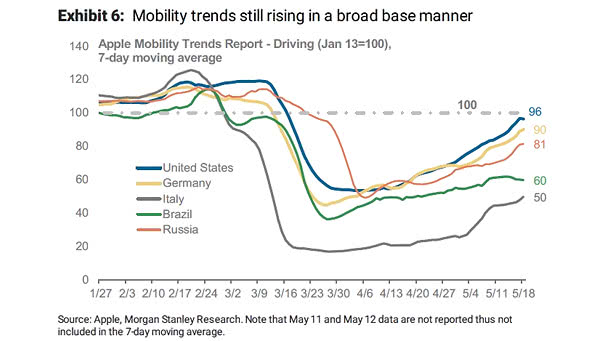
Indicator – Mobility Trends (Driving) This chart suggests that mobility (driving) in the United States is now back to January levels. Image: Morgan Stanley Research
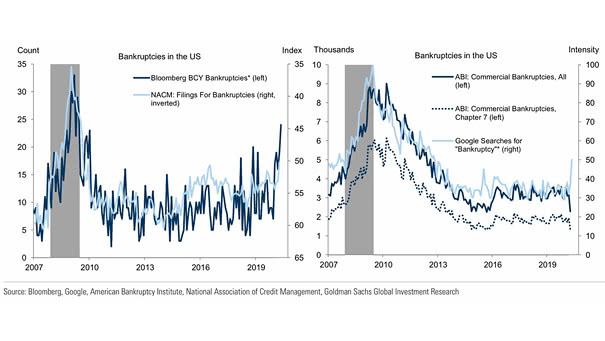
Bankruptcies and Coronavirus Crisis Filings for U.S. bankruptcies and Google searches for “Bankruptcy” are up. Image: Goldman Sachs Global Investment Research
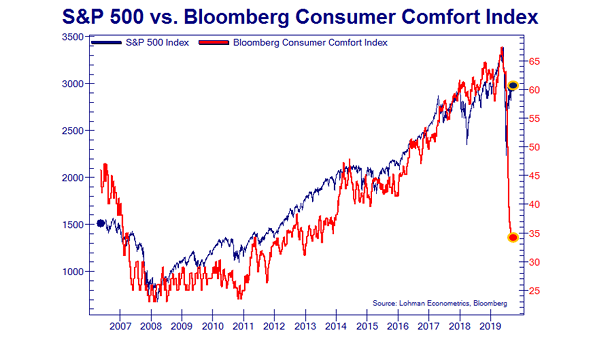
S&P 500 vs. Bloomberg Consumer Comfort Index This chart highlights the wide divergence between the S&P 500 and the growing anxiety among Americans on the condition of the U.S. economy, their personal finances and the buying climate.…
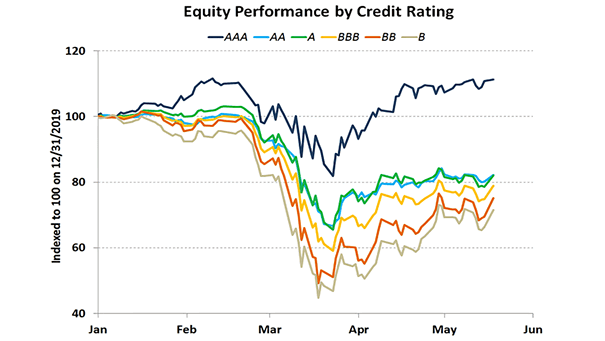
Equity Performance by Credit Rating This chart shows the impact of credit ratings on stock returns since the beginning of the year. Image: Ken Fisher, Fisher Investments
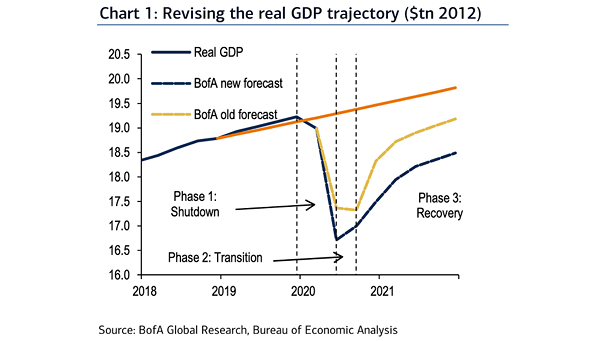
Revising the U.S. Real GDP Trajectory BofA is revising down the path of U.S. real GDP. Image: BofA Global Research
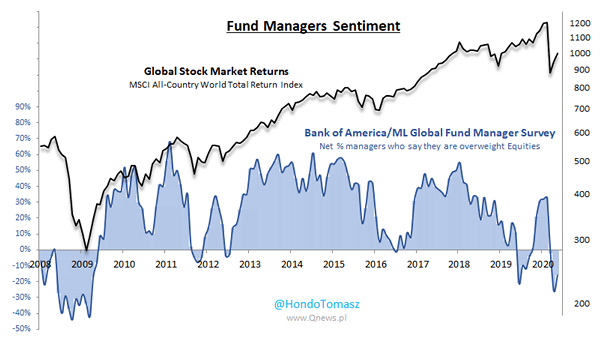
Fund Managers Sentiment and Global Stock Market Returns (MSCI ACWI) Are fund managers too bearish? Two-thirds of global fund managers say this is a bear market rally. Image: Hondo Tomasz
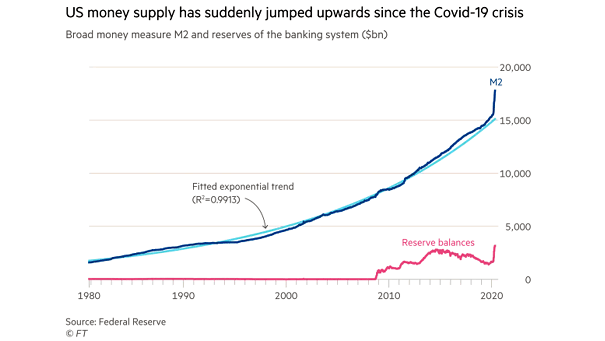
U.S. Money Supply M2 and Reserves of the Banking System U.S. money supply M2 shows significant jumps in growth, which could affect future inflation. Image: Financial Times
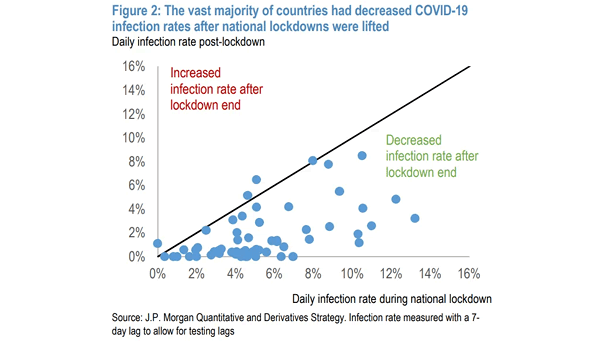
Daily Coronavirus Infection Rate Post-Lockdown On the positive side, this chart shows a decrease in COVID-19 infection rates after countries eased national lockdowns. Image: J.P. Morgan
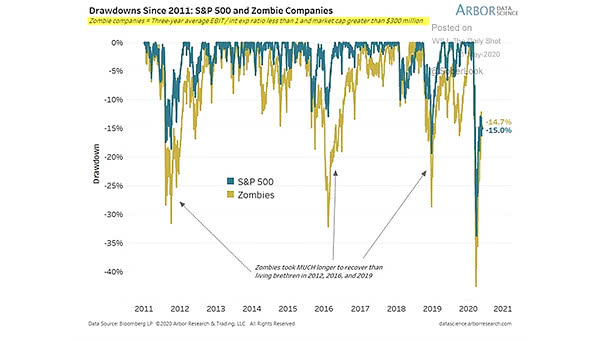
Drawdowns Since 2011: S&P 500 and Zombie Companies Since the March lows, zombie companies have outperformed the S&P 500 by a wide margin in April and May. Image: Arbor Research & Trading LLC
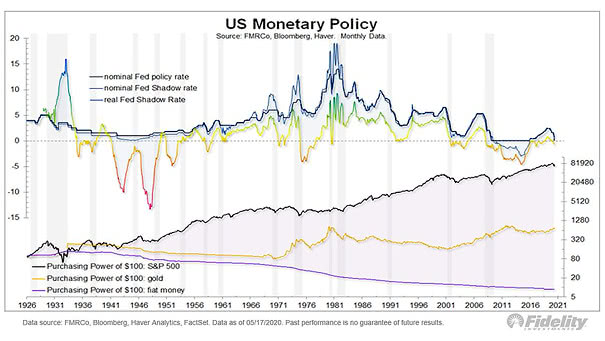
Purchasing Power of $100: S&P 500, Gold and Fiat Money Chart showing the purchasing power of $100 worth of fiat currency, gold and the S&P 500. Historically, stocks have won over the very long-term. Image:…