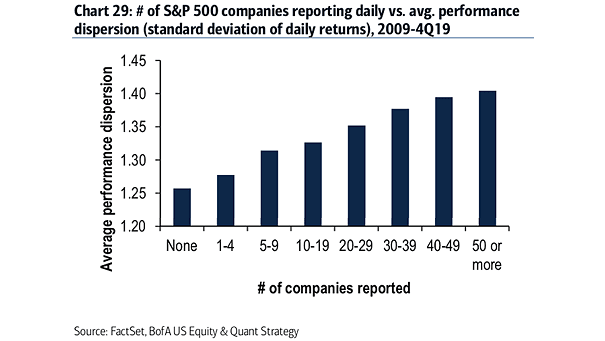
S&P 500 – Secular Bull Market Analogs

S&P 500 – Secular Bull Market Analogs The bull market that began in 2009 could have similarities with the secular bull markets of 1982-2000 and 1949-1968. Since the Great Recession, US stocks have behaved like…

U.S. Wage Growth and U.S. Unemployment Rate

U.S. Wage Growth and U.S. Unemployment Rate Has U.S. wage growth peaked? This chart suggests that the U.S. unemployment rate could bottom out at around 3.5% this year. Image: Oxford Economics

Gold Prices vs. Commodities

Gold Prices vs. Commodities The declining correlation between the price of gold and commodities may suggest that the commodity bear super-cycle is nearing its end. Image: Wells Fargo Investment Institute

U.S. Market Breadth

U.S. Market Breadth At the dotcom bubble peak, the percentage of stocks outperforming the S&P 500 was 27% vs. 42% today (the historical average is 48%). Currently, the relative market breadth isn’t as extreme as…

U.S. Nonstore Retail Sales

U.S. Nonstore Retail Sales This chart puts into perspective U.S. nonstore retail sales, which are a proxy measure for ecommerce performance. Image: The Daily Shot