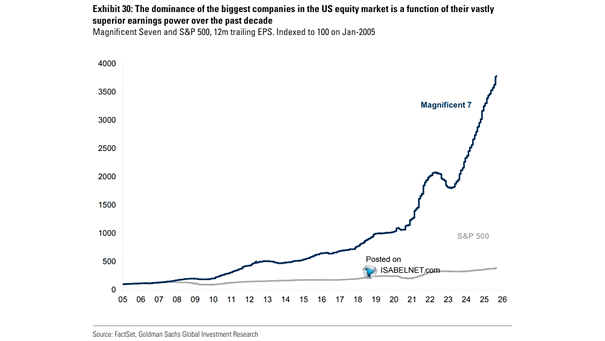
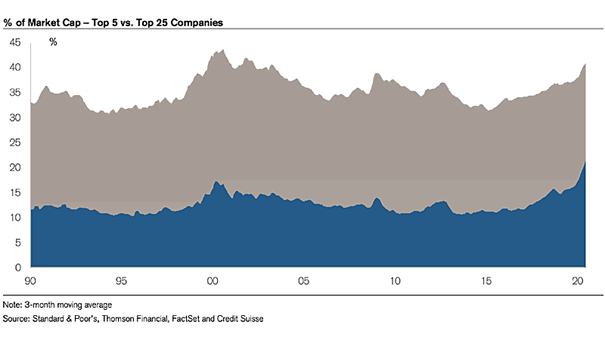
ISABELNET Cartoon of the Day
ISABELNET Cartoon of the Day In Wall Street, bears are like the prophets of doom, except instead of a fiery apocalypse, it’s just a market correction! Happy “Hump” Day, Everyone! 🐫🐪😎
Housing – CME Lumber Futures Price The combination of increased tariffs, supply constraints, and strong demand is creating a challenging environment for the lumber market, leading to significant price increases that are expected to continue…
Oil, 10 Year U.S. Treasury Yields and U.S. Dollar The increasing cohesion in recent years between oil prices, 10-year U.S. Treasury yields, and the U.S. dollar reflects deeper economic linkages and heightened sensitivity to policy…
U.S. 2s10s Yield Curve and Consensus Probability of a U.S. Recessions in the Next 12 Months Although fears of a U.S. recession have been mounting, the 2s10s U.S. Treasury yield curve’s recent steepening suggests a…
ISABELNET Cartoon of the Day As the S&P 500 tumbled into a 10% correction, bears are grinning, eager to deport bulls from Wall Street, but bulls remain optimistic, waiting for their visas to be extended!…
Valuation – MSCI World 12-Month Forward PE The current global stock market valuation, with a 12-month forward P/E ratio of 17.2, is relatively high compared to its 20-year median. Image: Goldman Sachs Global Investment Research
Foreign Ownership of U.S. Equities by Region European investors, major holders of U.S. stocks, could impact valuations if trade tensions rise, potentially shifting focus to European markets benefiting from fiscal stimulus and increased defense spending.…
S&P 500 Annualized Return per Day The S&P 500 has been up the past four Fridays, a trend that is particularly encouraging as it indicates sustained investor optimism and confidence in maintaining positions over the…
Valuation – S&P 500 Forward P/E At a forward P/E multiple of 20x, the S&P 500 is trading at the low end of the trading range, which is below its 12-month average of 21x. Image:…
ISABELNET Cartoon of the Day Bulls ran wild on Wall Street after the S&P 500’s meteoric 0.51% rise this week, prompting calls for a new economic era, while bears are desperately Googling “how to sell…
ACWI Ex-U.S. vs. U.S. 3-Month Correlation and U.S. Equity 3-Month Return When U.S. equities experience a sell-off, it often indicates underlying worries about the global economy or financial system, triggering risk aversion. This typically leads…