U.S. Wage Growth and Business Cycles
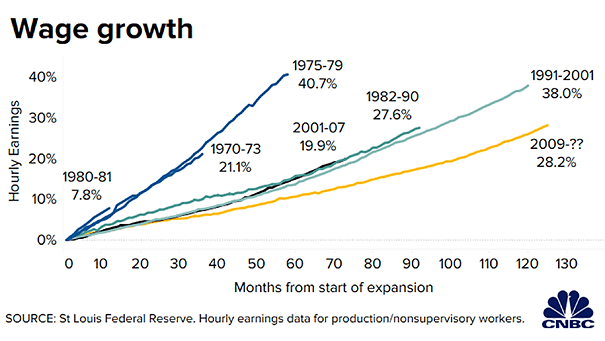
U.S. Wage Growth and Business Cycles Despite the U.S. economic expansion is now the longest in history, wage growth has been much slower during this business cycle than in previous cycles. Image: CNBC
U.S. Wage Growth and Business Cycles Despite the U.S. economic expansion is now the longest in history, wage growth has been much slower during this business cycle than in previous cycles. Image: CNBC
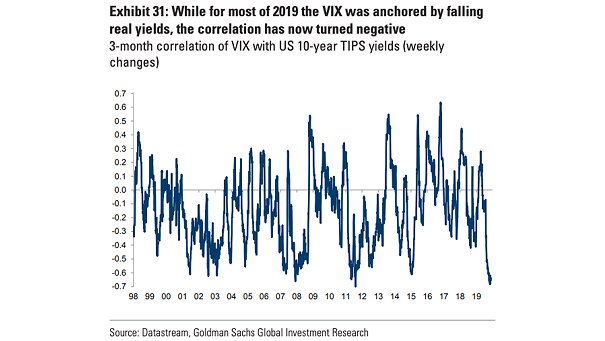
Correlation of VIX with U.S. 10-Year TIPS Yields The correlation of the VIX with U.S. 10-year TIPS yields has turned negative, as it was during the dot-com bubble burst, the Great Financial Crisis, the European…
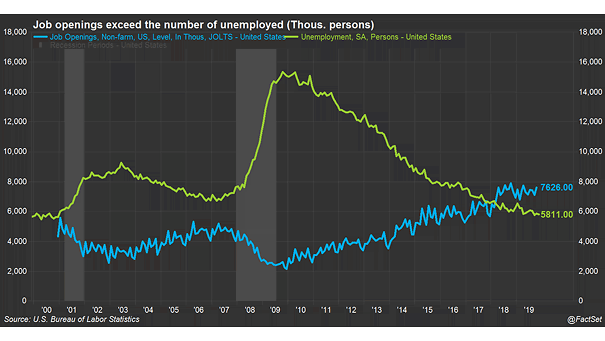
U.S. Job Openings and Unemployment The U.S. labor market is very tight. There are still more open jobs than unemployed workers. Image: FactSet
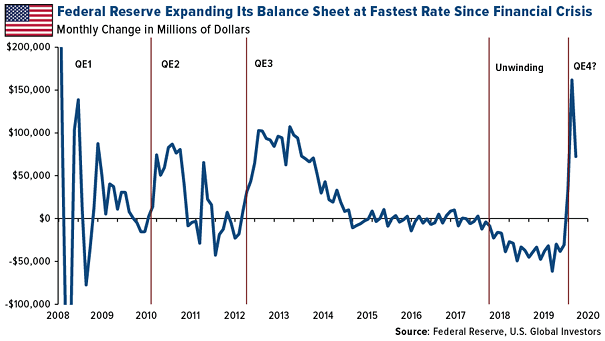
Federal Reserve’s Balance Sheet and “Not QE” Welcome to “Not-QE”. The Fed’s balance sheet is expanding at fastest rate since the Great Financial Crisis. Image: US Global Investors
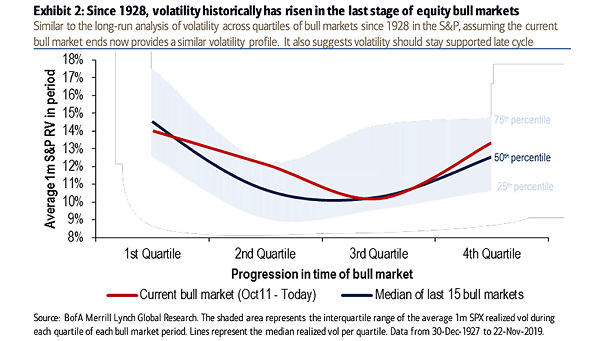
Volatility and Equity Bull Markets Since 1928, when equities are still rising, volatility tends to increase in the last stage of bull markets. Image: BofA Merrill Lynch Global Research
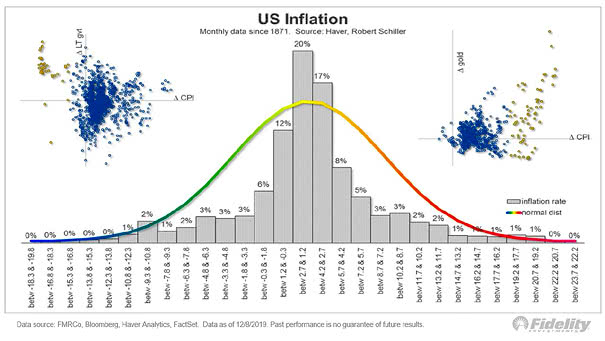
Distribution of U.S. Inflation Rate Is inflation really dead? It may not be dead forever. This great chart shows that the distribution of the U.S. inflation rate has been fairly good since 1871. Image: Fidelity…
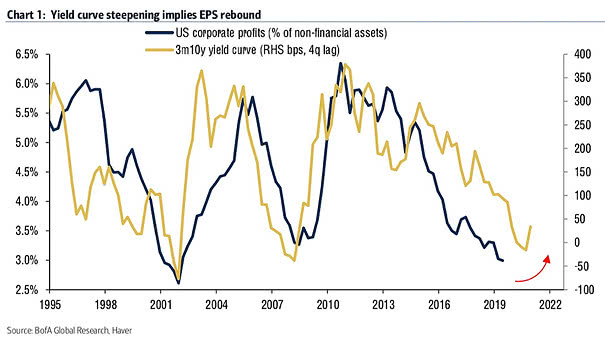
U.S. Corporate Profits and 10Y-3M Yield Curve While the divergence between large-cap profits and the rest of the economy is the widest on record, the steepening yield curve suggests an earnings rebound. Image: BofA Global…
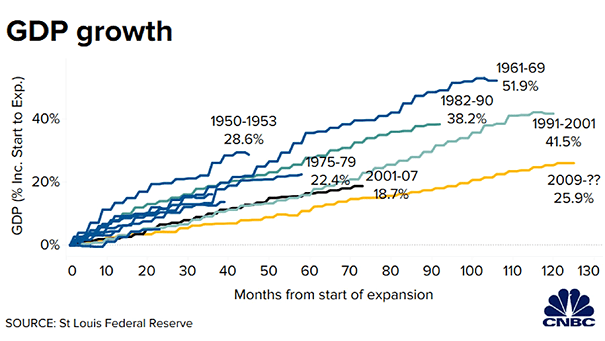
U.S. GDP Growth and Business Cycles Despite the current U.S. economic expansion is the longest ever, GDP growth has been much slower during this business cycle than in previous cycles. Image: CNBC
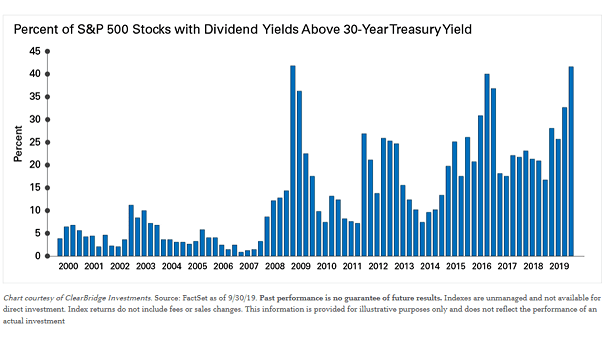
S&P 500 Stocks with Dividend Yields Above 30-Year Treasury Yield Yields on U.S. equities seem competitive vs. U.S. Treasuries, but equity risk does not disappear because a company pays a dividend. Image: Legg Mason
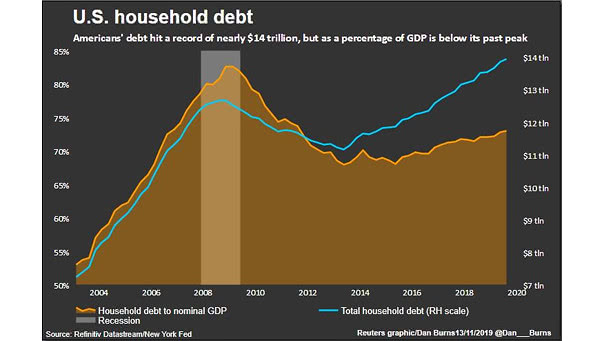
U.S. Household Debt American debt hits a record high of $13.95 trillion and represents about 73% of GDP vs. about 83% a decade ago. Image: Reuters
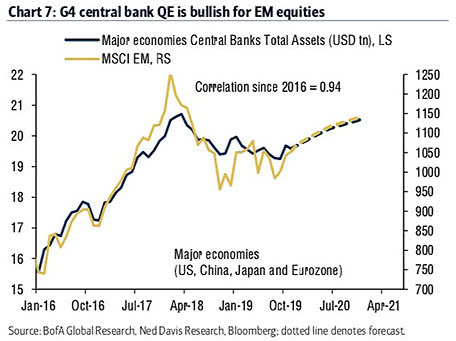
G4 Central Bank QE and Emerging Markets Equities This chart suggests that G4 central bank stimulus would support emerging markets equities in 2020 (R = 0.94 since 2016). Image: BofA Global Research