China Debt to GDP
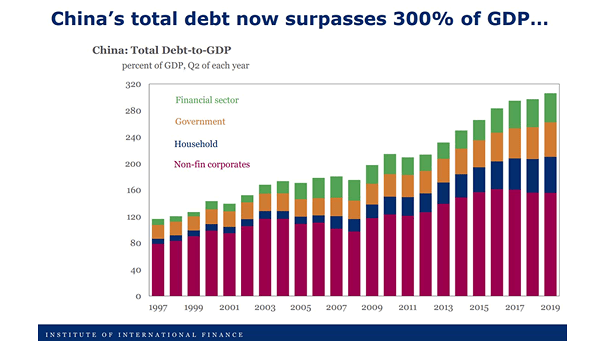
China Debt to GDP China’s increase in debt is massive and now exceeds 300% of GDP. Image: Institute of International Finance
China Debt to GDP China’s increase in debt is massive and now exceeds 300% of GDP. Image: Institute of International Finance
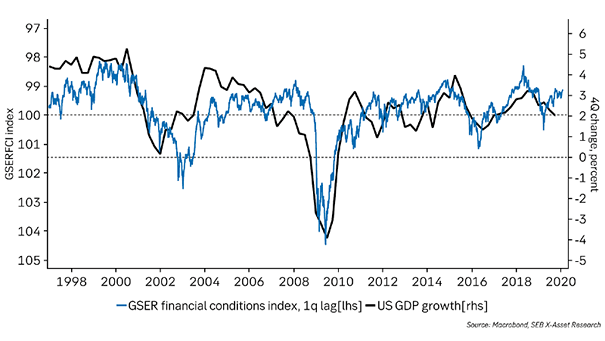
GSER Financial Conditions Index and U.S. GDP Growth Chart suggesting that financial conditions should improve U.S. GDP growth. Image: Macronond, SEB X-Asset Research
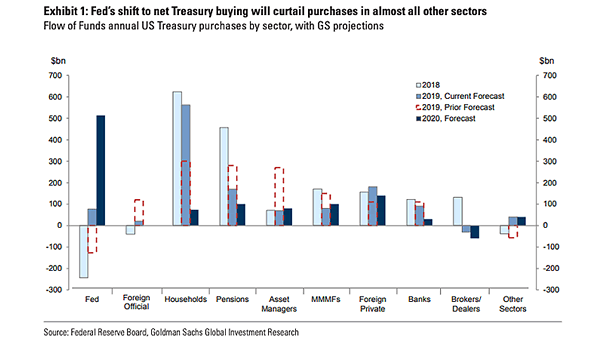
Fed and Flow of Funds Annual U.S. Treasury Purchases by Sector In 2020, the Fed is expected to buy more than $510 billion in U.S. Treasuries. Image: Goldman Sachs Global Investment Research
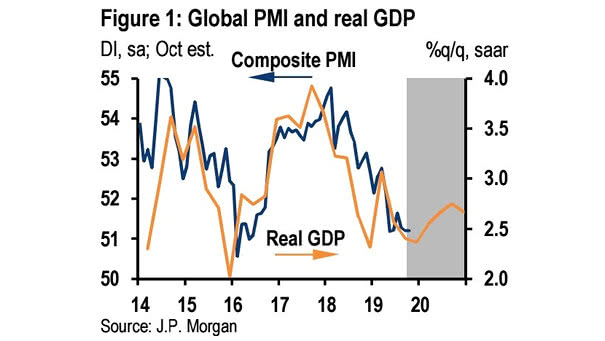
Global PMI and Real GDP Chart showing the correlation between global PMI and real GDP. Is the worst over for global PMI? Image: J.P. Morgan
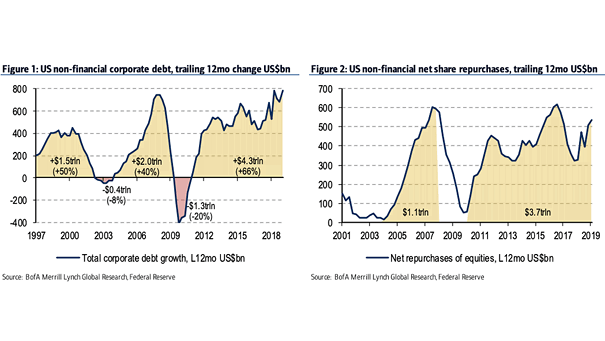
U.S. Non-Financial Corporate Debt and Net Share Repurchases (Buybacks) Thanks to low interest rates, U.S. companies are increasingly using debt to buy back shares. Image: BofA Merrill Lynch Global Research
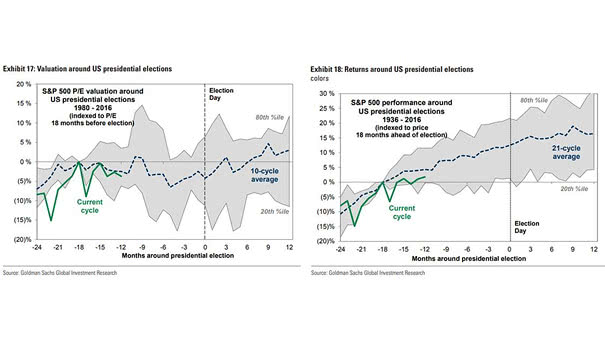
Valuation and Returns around U.S. Presidential Elections Historically, the S&P 500 has performed well in the 12 months prior to an U.S. election. Image: Goldman Sachs Global Investment Research
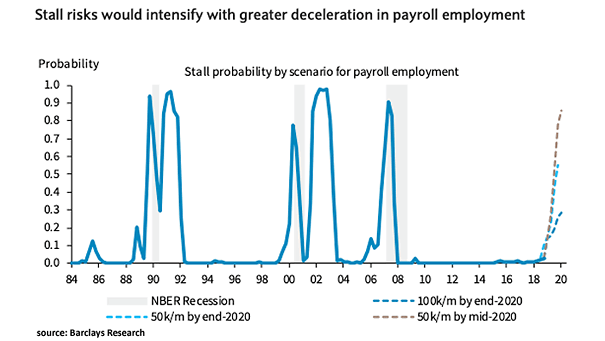
Stall Probability by Scenario for U.S. Payroll Employment Chart suggesting that stall risks rise considerably and could intensify with greater deceleration in payroll employment in 2020. Image: Barclays Research
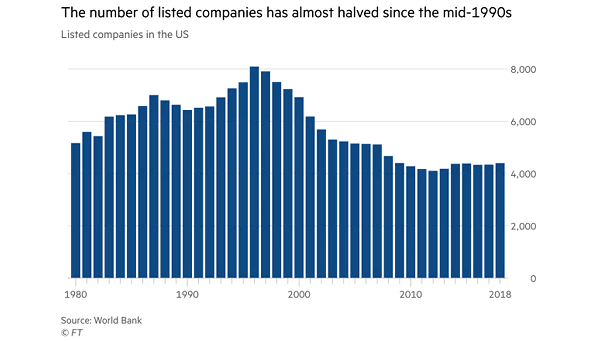
Number of Listed Companies in the U.S. The U.S. stock market is shrinking. There are fewer firms listed on U.S. stock exchanges than 20 years ago. Image: Financial Times
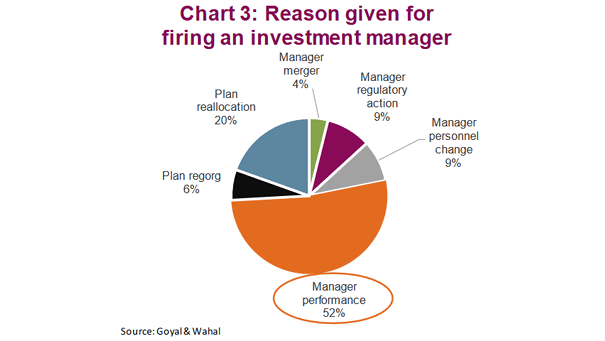
Reason Given For Firing an Investment Manager The manager’s performance is always what matters in the end. Image: Richardson Wealth
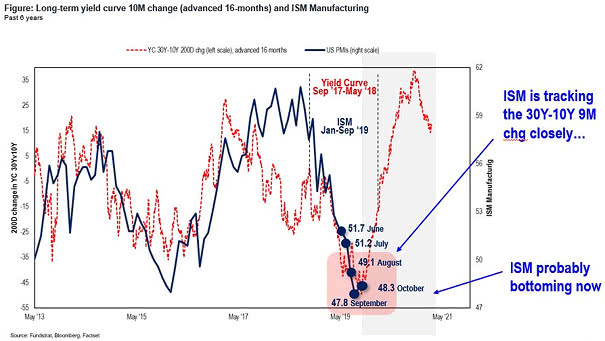
200D Change in Yield Curve 30Y-10Y Leads U.S. ISM Manufacturing Index This great chart suggests that 200-Day Change in Yield Curve 30-Year minus 10-Year spread leads U.S. ISM Manufacturing Index by 16 months. It also suggests…
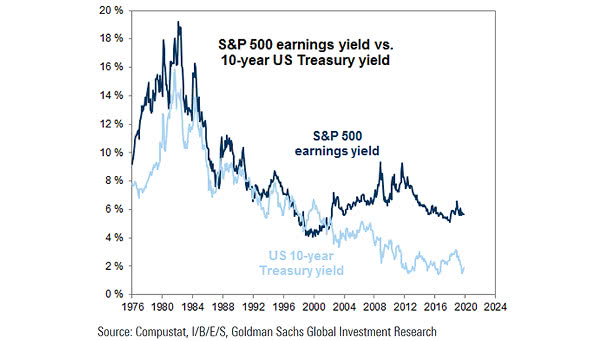
S&P 500 Earnings Yield vs. 10-Year U.S. Treasury Yield The gap between the S&P 500 earnings yield and the 10-year U.S. Treasury yield is currently relatively high. Image: Goldman Sachs Global Investment Research