Probability of A Recession Over the Next 12 Months
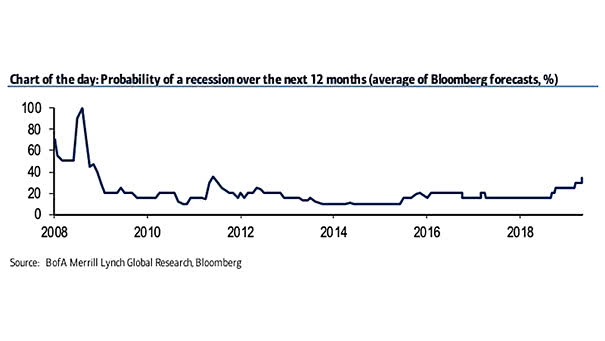
Probability of A Recession Over the Next 12 Months The Bloomberg survey of professional forecasters shows a 35% probability of a recession over the next 12 months Image: BofA Merrill Lynch
Probability of A Recession Over the Next 12 Months The Bloomberg survey of professional forecasters shows a 35% probability of a recession over the next 12 months Image: BofA Merrill Lynch
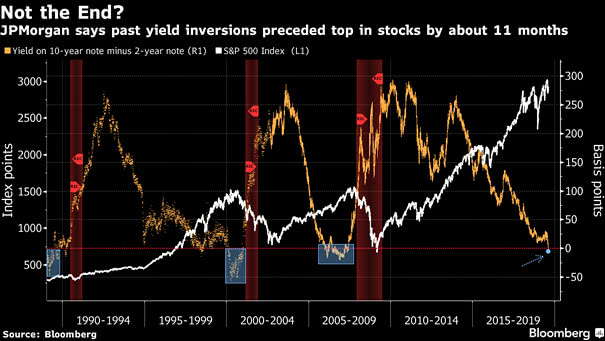
Past Yield Curve Inversions Preceded Top in Stocks by About 11 Months In the 12 months following an inversion of the yield curve, the S&P 500 return averaged about 10%. Image: Bloomberg

U.S. GDP and S&P 500 This interesting chart puts market corrections and U.S. GDP in perspective. Image: Oxford Economics, Macrobond
U.S. Leading Economic Indicators (LEI) and Fed Insurance Rate Cuts This chart shows that Fed insurance rate cuts can be good news when the U.S. economy slows down. Image: Scotiabank
Time Between Recent Yield Curve Inversions and Recessions The U.S. 10-Year/3-Month yield spread has inverted before each of the past seven recessions. Image: Bloomberg
U.S. 10-Year/3-Month Yield Spread and Recessions This chart shows that inversions of the U.S. 10-Year/3-Month yield spread have preceded recent recessions Image: Bloomberg
Inequality: CEO Compensation vs. Typical Worker Compensation in the U.S. CEO compensation has grown 940% since 1978, while typical worker compensation has risen by only 12%. Image: Economic Policy Institute
S&P 500 Performance by President, from Reagan to Trump For President Trump, the stock market is a scorecard. This chart shows the S&P 500 performance across different presidencies, from Reagan to Trump. Image: Deutsche Bank
S&P 500 and the Shortest Maturity U.S. Treasury Yielded Highest Houston, we have a problem! Image: OddStats
U.S. GDP and S&P 500: Change in the Three Years After a Recession Began U.S. GDP has declined by about 1.4% over two quarters since World War II, and in the worst recessions, the S&P…
How Many Recessions People Lived Through As An Adult? This chart puts recessions into perspective. Currently, about 40 million American adults haven’t experienced a single recession during their working lives. Image: The Washington Post