S&P 500 Index – Earnings & Valuation
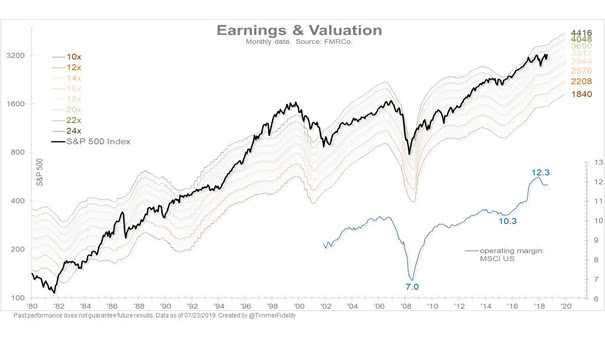
S&P 500 Index – Earnings & Valuation The S&P 500 valuation is high relative to history and the earnings growth estimate has fallen to +3.7% for 2019. You may also like our “Stock Market Valuation.”…
S&P 500 Index – Earnings & Valuation The S&P 500 valuation is high relative to history and the earnings growth estimate has fallen to +3.7% for 2019. You may also like our “Stock Market Valuation.”…
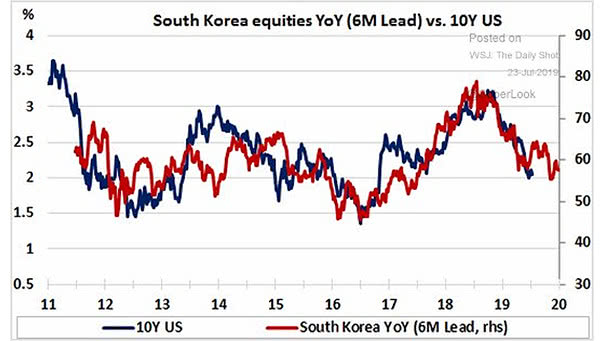
South Korea Equities Lead U.S. 10-Year Treasury Yield Interesting chart suggesting that South Korea equities YoY lead the U.S. 10-year Treasury yield by 6 months. Image: Rothko Research
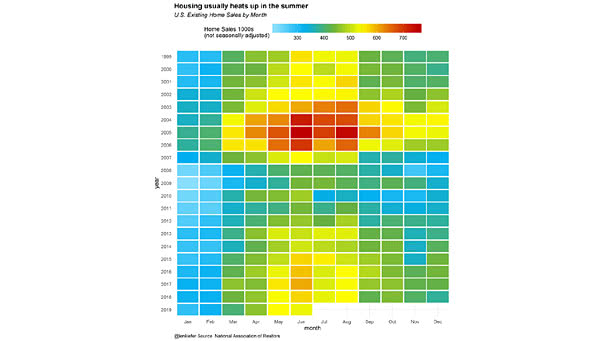
Housing Usually Heats Up in the Summer This great chart shows that U.S. home sales usually heats up in the summer. Image: Leonard Kiefer
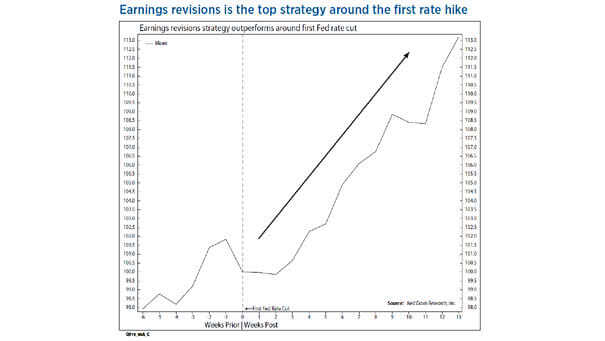
Earnings Revisions Strategy Outperforms Around First Fed Rate Cut Around first Fed rate cut, earnings revisions is the top factor out of 200 strategies. Image: Ned Davis Research
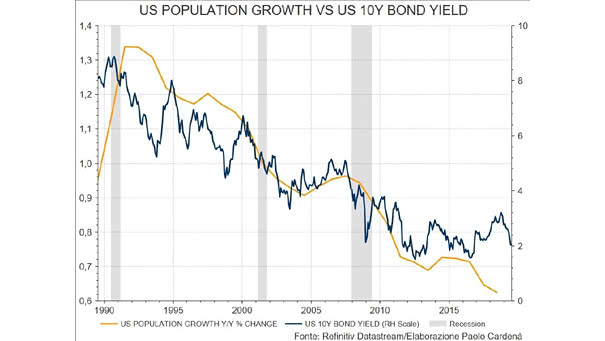
U.S. Population Growth vs. U.S. 10-Year Treasury Bond Yield U.S. demographics explain the 10-year Treasury bond yield, due to low inflation. The U.S. 10-year bond yield reflects inflation and growth expectations, and working age population…
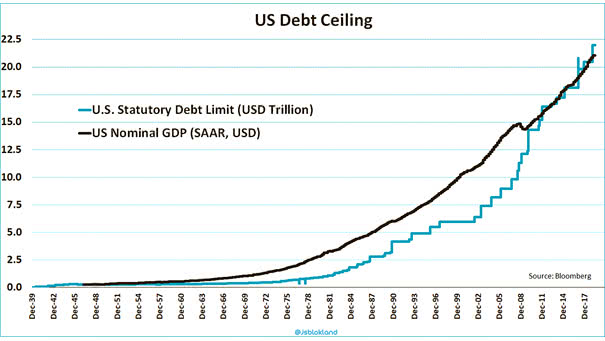
U.S. Debt Ceiling and U.S. Nominal GDP The statutory debt limit, also called the debt ceiling, is the statutory maximum of money the U.S. Treasury is allowed to borrow.Now, it is higher than U.S. nominal…
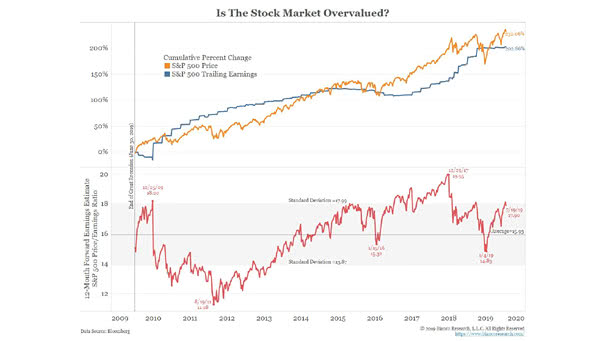
Is The U.S. Stock Market Overvalued? S&P 500 Valuation: the chart shows that the U.S. stock market is not cheap. Based on the forward P/E ratio, the S&P 500 is not extremely overvalued either. You…
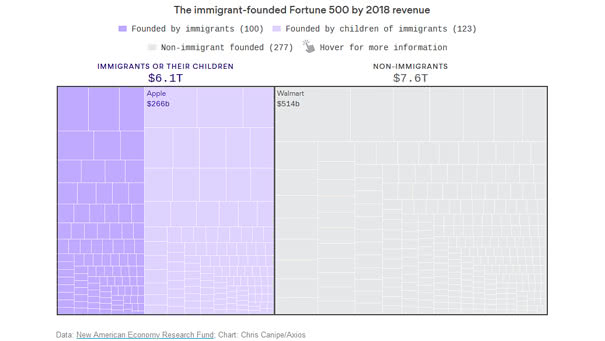
The Immigrant-Founded Fortune 500 Immigrants and their children have founded nearly half of all U.S. Fortune 500 companies. Image: Axios
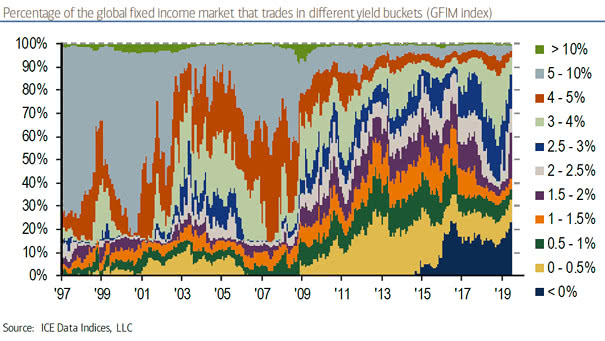
Global Fixed Income Market In Different Yield Buckets Nowadays, the scarcity of yield with 20% of global bonds below 0%. Image: ICE Data Indices, Bank of America Merrill Lynch
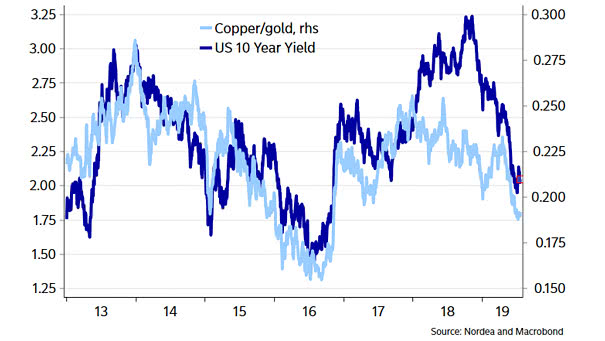
Copper to Gold Ratio and U.S. 10-Year Treasury Yield The chart suggests that the correlation between the copper/gold ratio and the US 10-year Treasury yield is still valid. Image: Nordea and Macrobond
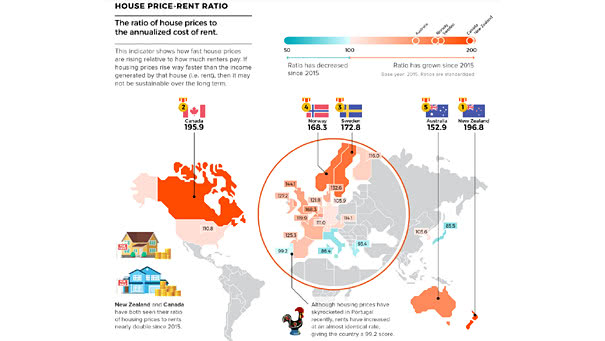
Countries With the Highest Housing Bubble Risks Detecting and measuring asset bubbles is not always an easy task, but in many countries, housing prices are rising faster than rental rates. Image: Visual Capitalist