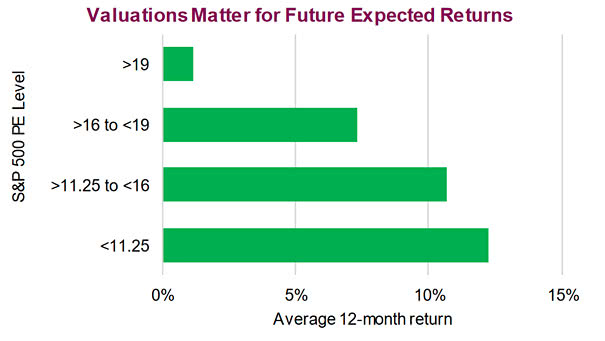
S&P 500 Index – Number of 2.5% Drops Per Month
S&P 500 Index – Number of 2.5% Drops Per Month This chart shows that this month of August is volatile compared to other years. Image: Ryan Detrick, LPL Financial LLC
Sovereign Bonds with Negative Yields This chart puts things into perspective by showing the share of developed market sovereign bonds with negative yields (1-10 year maturities). Image: Credit Suisse
VIX and MOVE Correlation Periods of high correlation between VIX and MOVE are not good for balanced portfolios, because diversification is hard to find. Image: Arbor Research & Trading LLC
Percentage of Stocks That Beat the S&P 500 by Year This chart shows that the percentage of U.S. stocks that beat the S&P 500 in a given year is not small, but stock picking is…
S&P 500 Forecast for 2019 Goldman Sachs is holding its year-end price-target for the S&P 500 at 3100, and its downside scenario at 2620 (as of August 23, 2019). Image: Goldman Sachs Global Investment Research
U.S. Average Tariff on All Imports A look at U.S. tariffs in the past and where they are today. Average U.S. tariffs were close to 1%, until President Trump decided to raise them. Image: BofA…
S&P 500 Weekly Losing Streaks Currently, the S&P 500 is down 4 straight weeks. But the chart below shows that long weekly losing streaks are rare. Image: Ryan Detrick, LPL Financial LLC
Negative Yielding European Corporate Bonds Now, €1.1 trillion of European corporate bonds yield are below zero: exactly half of the European high-grade credit market. Image: BofA Merrill Lynch
Central Bank Balance Sheet to GDP Ratios Central bank balance sheet to GDP ratios, influenced by monetary policy, vary from one economy to another. Image: Bianco Research
Gold Sentiment at Annual High The gold price ‘risk radar’ index is flashing red (-2.1 standard deviations). Image: Sentix, Bloomberg Finance L.P.