Jun
02
2019
Off
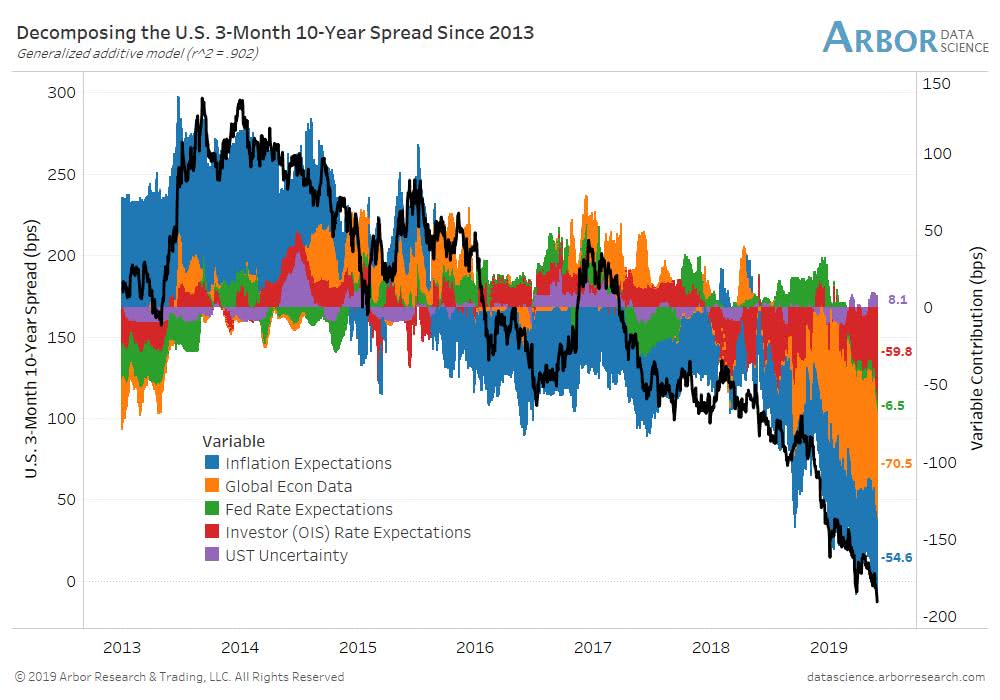
Decomposing the U.S. 10-Year minus 3-Month Treasury Yield Spread since 2013
This great chart shows that the “Global Economic Data” variable has a significant impact on the U.S. 10-year minus 3-month Treasury yield spread since 2018. An R² of 0.902 means that more than 90 percent of the variance in the U.S. 10-year minus 3-month Treasury yield spread is predictable by the flows of data used. An R² of 0.902 also corresponds to a 94.97% correlation. It’s a high correlation.
The variables used by this model are as follow: inflation expectations + global economic data + Fed rate expectations + investor (OIS) rate expectations + UST uncertainty
Image: Arbor Research & Trading LLC