S&P 500 Payout Ratio
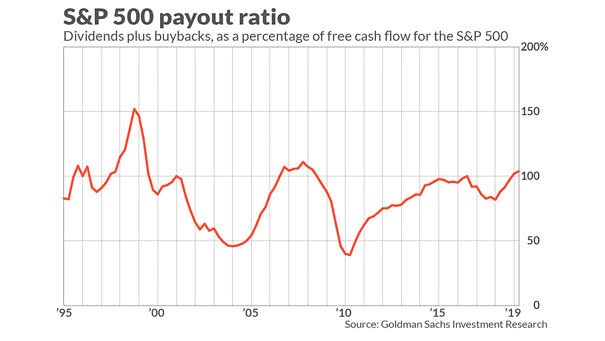
S&P 500 Payout Ratio Stock buybacks and dividends as a percentage of free cash flow are reaching dangerous levels. Image: MarketWatch
S&P 500 Payout Ratio Stock buybacks and dividends as a percentage of free cash flow are reaching dangerous levels. Image: MarketWatch
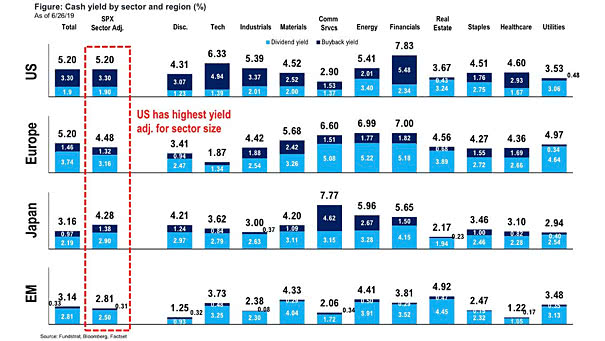
S&P 500 Cash Return Yield by Sector and Region Currently, the S&P 500 cash return yield (buybacks + dividends) is 5.2%, the highest since 2011. That’s much more than Europe, Japan and emerging markets. Image: Fundstrat Global Advisors, LLC

Do You Really Think That, By Buying the S&P 500, You Never Lose Money? Well, even if it is not adjusting for inflation with dividends, this chart is very interesting. That’s the reason why we develop stock market forecasting models. Image: Frank Jurs
Stock Market Forecasting Models vs. US Stock Market – Growth of $1,000 As an example, the chart shows the growth of $1,000 since 1970, between the stock market forecasting models and the US stock market (compound return before taxes, fees and transactions costs – unleveraged, simulated long & short trades – quarterly basis & logarithmic…
U.S. Corporate Stock Buybacks Are Booming Since 2010! Thanks to tax cuts and low interest rates. What would happen if companies reinvested instead of buying their own shares? Unfortunately, artificially low interest rates are associated with unnecessary debt. See how corporate debt-to-GDP has increased since the Great Recession.
Why the US Stock Market Was Overvalued by 14.2% on Oct. 1, 2018 vs. 7.7% Today? Because the value of the forecast changes over time (blue dotted line). The US stock market short-term forecast (S&P 500 with dividends reinvested) for the next 12 months is available to our subscribers. This great prediction model is updated daily.…
https://www.isabelnet.com/wp-content/uploads/2019/03/stock-market-long-term-forecast.mp4 This great long-term forecast model displays the annual and total return expected for the next 10 years with a high degree of confidence This advanced model makes a forecast for the next 12 months, next 3 years, next 5 years, and next 10 years, with dividends reinvested. For each period, it displays the annual…
https://www.isabelnet.com/wp-content/uploads/2019/03/stock-market-short-term-forecast.mp4 This great tool shows the US stock market forecast for the next 12 months and the probability This advanced mathematical model extracts insights from multiple financial data and suggests a stock market short-term forecast for the next 12 months with a very high degree of confidence. This great prediction model is updated daily, with…
PREMIUM MEMBERSHIP – Click the Images to Enlarge Video tutorials are available by clicking on this link: “FORECASTING MODELS” located in the menu bar at the top of each page. Our daily Stock Market Bull and Bear Indicator is available in the Pro Membership. Upgrade your Premium Membership to a Pro Membership Now! The period of…
PRO MEMBERSHIP – Click the Images to Enlarge Video tutorials are available by clicking on this link: “FORECASTING MODELS” located in the menu bar at the top of each page.
BASIC MEMBERSHIP – Click the Images to Enlarge Video tutorials are available by clicking on this link: “FORECASTING MODELS” located in the menu bar at the top of each page. Our daily Stock Market Bull and Bear Indicator is available in the Pro Membership. Upgrade your Basic Membership to a Pro Membership Now! The period of…