U.S. Inflation since 2000

U.S. Inflation since 2000 U.S. households are more concerned about the rising cost of medical care and housing, than overall inflation. Image: Financial Times

Valuation and Global Asset Price Cycle

Valuation and Global Asset Price Cycle Interesting chart showing the current average overvaluation estimates across equities, bonds and house prices in major advanced economies. Image: Oxford Economics

Cumulative S&P 500 Buybacks 2009-2019

Cumulative S&P 500 Buybacks 2009-2019 Are buybacks driving the show? Thanks to tax cuts and low interest rates, corporate stock buybacks are booming. Over the past decade, S&P 500 companies bought back $5 trillion shares, while cumulative flows from households and foreigners are only a drop in the bucket. But what would happend if companies reinvested instead…

Detecting and Measuring Asset Bubbles

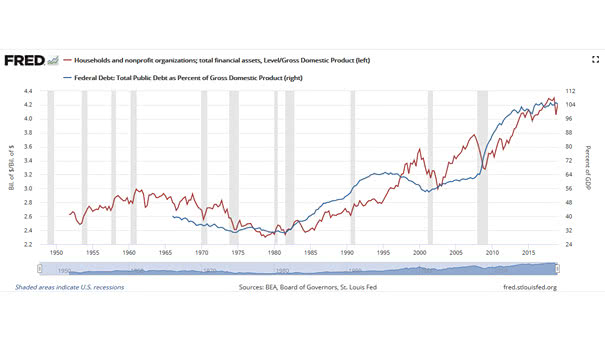
Detecting and Measuring Asset Bubbles Detecting and measuring asset bubbles is not always an easy task. This chart puts into perspective the current U.S. households financial assets to GDP and the U.S. federal debt as percentage of GDP.

Who Owns the Equity Market?

Who Owns the Equity Market? Most of the equity market is owned by households and mutual funds. But ETFs and foreigners continue to gain share. Image: Bianco Research

Concentration of Stock Ownership by Wealth Bracket

Concentration of Stock Ownership by Wealth Bracket As the chart shows, the top 20% wealthiest American households own over 93% of stocks. You may also like “How the Composition of Wealth Changes from the Middle Class to The Ultra Rich?” and “U.S. Net Worth by Wealth Bracket.” Image: Visual Capitalist

How Average Americans Spend their Money?

How Average Americans Spend their Money? The average American household – $53,708 in spending. That’s 73% of total income. Image: Visual Capitalist