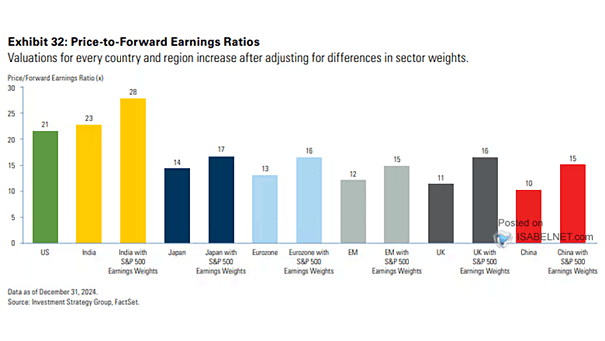
S&P 500 and New 52-Week Highs and New 52-Week Lows

S&P 500 and New 52-Week Highs and New 52-Week Lows The percentage of S&P 500 stocks at new 52-week highs confirms the break above the low 4600s, signaling a positive market sentiment and a potential upward trend for stocks. Image: BofA Global Research

Valuation – S&P 500 Forward P/E

Valuation – S&P 500 Forward P/E Ratio The valuation of the S&P 500 index tends to expand after the Fed’s first cut, providing valuable insight into the potential impact of the Fed’s decisions on the U.S. stock market. Image: Goldman Sachs Global Investment Research

Hedge Fund and Mutual Fund Equity Exposure

Hedge Fund and Mutual Fund Equity Exposure Hedge funds and mutual funds have increased their allocation to equities over the course of this year, indicating a growing confidence in the stock market. Image: Goldman Sachs Global Investment Research

S&P 500 Realized Volatility During Recession

S&P 500 Realized Volatility During Recession During recessions, there is often increased uncertainty and risk aversion among investors, which can lead to higher levels of volatility in the U.S. stock market. Image: BofA Global Research

S&P 500 Price Returns by Year of Presidential Cycle

S&P 500 Price Returns by Year of Presidential Cycle While the fourth year of the presidential cycle has historically been favorable for the U.S. stock market, it tends to have lower returns compared to the third year. Image: Goldman Sachs Global Investment Research

S&P 500 McClellan Oscillator

S&P 500 McClellan Oscillator The bullish divergence in the S&P 500 McClellan oscillator implies underlying buying pressure, signaling positivity for U.S. stocks and increasing the likelihood of a market reversal or bounce back. Image: BofA Global Research

S&P 500 Advance-Decline Line

S&P 500 Advance-Decline Line The bullish retest of the breakout to new all-time highs for S&P 500 advance-decline in June is very good news for the U.S. stock market. Image: BofA Global Research

Cumulative Equity Inflows vs. S&P 500

Cumulative Equity Inflows vs. S&P 500 Investors have been moving their money from stocks to bonds and money market funds, resulting in flat flows into equities since the start of the year. Image: BofA Global Investment Strategy

Valuation – Mega-Cap Tech Relative NTM P/E vs. Rest of S&P 500

Valuation – Mega-Cap Tech Relative NTM P/E vs. Rest of S&P 500 The concentration of mega-cap tech stocks in the S&P 500 Index has raised concerns that the market is being pulled up by a handful of stocks. Image: Goldman Sachs Global Investment Research