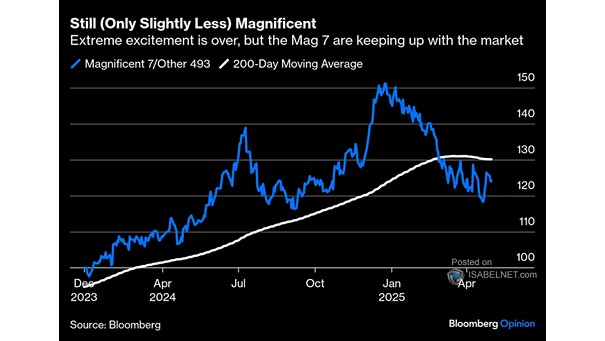
S&P 500 and Stoxx600 – Q3 2025 Reporting Season Calendar

S&P 500 and Stoxx600 – Q3 2025 Reporting Season Calendar About 16% of S&P 500 firms report earnings this week, but the real test comes next week, with roughly 44% set to deliver results—a pivotal moment that could set the tone for the rest of the season. Image: J.P. Morgan

Year/Year EPS Growth – Magnificent 7 vs. S&P 493

Year/Year EPS Growth – Magnificent 7 vs. S&P 493 EPS growth for the Magnificent 7 is expected to cool to 14% in Q3, down from 28%. Mega-cap tech names should continue posting robust earnings growth, but the outsized premium that’s defined the trade might lose some of its shine in 2026. Image: Goldman Sachs Global…

Contribution of Sector Groups to S&P 500 Earnings Growth

Contribution of Sector Groups to S&P 500 Earnings Growth MCG and Tech have all but carried the market lately, fueling nearly 90% of the S&P 500’s earnings growth. Wall Street’s climb is still a tech‑powered story, with breadth across other sectors stubbornly missing. Image: Deutsche Bank Asset Allocation

Median Excess Return vs. S&P 500 on Day After Earnings Report

Median Excess Return vs. S&P 500 on Day After Earnings Report Strong earnings surprises boosted U.S. stocks in 2Q, but with already high expectations entering the quarter, the price reaction was somewhat limited compared to previous quarters. Image: Goldman Sachs Global Investment Research

S&P 500 – Share of Sales Derived from Outside United States

S&P 500 – Share of Sales Derived from Outside United States The “Magnificent Seven” tech giants are more exposed to global trade risks than the rest of the S&P 500, as 49% of their revenue comes from foreign sales. Image: Goldman Sachs Global Investment Research

S&P 500 Index

S&P 500 Index The current rally is underpinned by solid employment data and improving trade sentiment. If the S&P 500 can sustain levels above 6,000, the only major resistance ahead is the all-time high near 6,150. Image: Bloomberg

Magnificent Seven Stocks vs. S&P 500 Index

Magnificent Seven Stocks vs. S&P 500 Index Since DeepSeek’s emergence in January 2025, the Magnificent Seven stocks have underperformed compared to the S&P 500, driven by AI disruption fears and concerns over capital expenditures. Image: Deutsche Bank

Inflation – S&P 500 LTM Sales Growth vs. Core CPI Since 1970

Inflation – S&P 500 LTM Sales Growth vs. Core CPI Since 1970 Rising inflation tends to boost S&P 500 earnings. According to Goldman Sachs, a 100bp increase in average annual core CPI would lift the S&P 500 EPS to $170 in 2021. Image: Goldman Sachs Global Investment Research

Valuation: Utilities vs. Tech vs. S&P 500

Valuation: Utilities vs. Tech vs. S&P 500 Nice chart showing the valuation of utilities vs. Tech and the S&P 500. Currently, utilities are valued at 19.9x forward EPS, tech at 18.7x, and the S&P 500 at 16.4x Image: Fidelity Investments