S&P 500 Forward Earnings Estimates
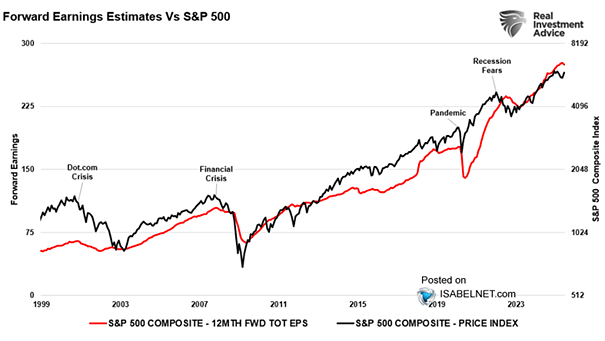
S&P 500 Forward Earnings Estimates The fundamental earnings trajectory for the S&P 500 remains robust, with accelerating growth anticipated through 2026, underpinning a cautiously optimistic market outlook, despite various bearish headlines and market volatility. Image: Real Investment Advice