ISM Non-Manufacturing Index vs. U.S. GDP
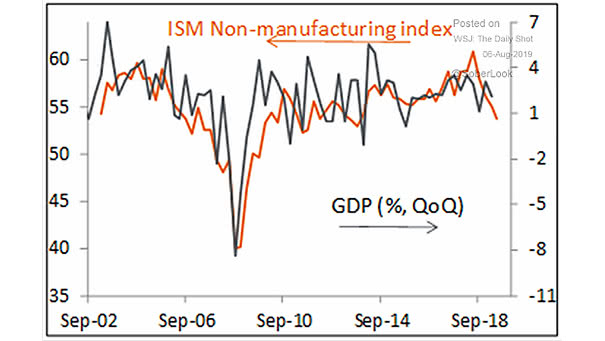
ISM Non-Manufacturing Index vs. U.S. GDP The chart shows the good correlation between ISM Non-Manufacturing PMI and U.S. GDP. Image: Piper Jaffray
ISM Non-Manufacturing Index vs. U.S. GDP The chart shows the good correlation between ISM Non-Manufacturing PMI and U.S. GDP. Image: Piper Jaffray
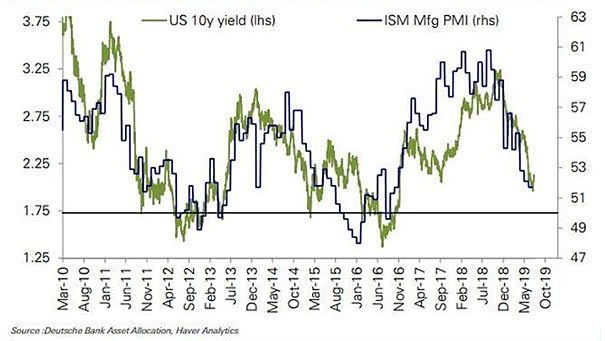
ISM Manufacturing Index and U.S. 10-Year Treasury Bond Yield The decline in U.S. 10-year Treasury bond yields has been in line with falling ISM PMI. Picture Source: Deutsche Bank

2019 Is Tracking Similar to Prior Waterfall Declines Where PMI was above 50 at end of 19% decline in 60 days. So, it suggests 3,100 for the S&P 500 by year end. Image: Fundstrat
ISM Manufacturing vs. 10-Year Treasury Yields This chart shows a nice correlation between ISM manufacturing index and 10-year Treasury yields since 2010. This chart can explain why 10-year Treasury yields have fallen. PMI index above 50 percent indicates that the manufacturing economy is expanding, and a PMI index below 50 percent indicates that the manufacturing…