U.S. Small Cap vs. U.S. Value Fund Cumulative Flows
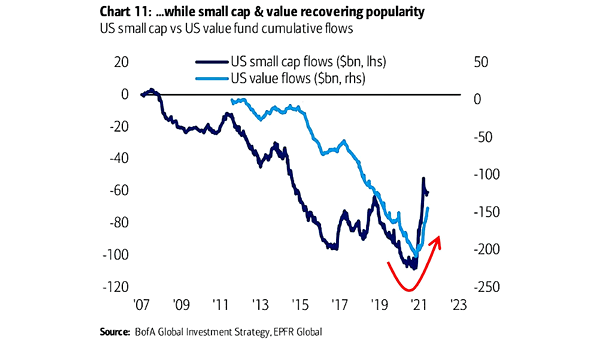
U.S. Small Cap vs. U.S. Value Fund Cumulative Flows Flows into small cap and value funds are improving amid rising inflation. Image: BofA Global Investment Strategy
U.S. Small Cap vs. U.S. Value Fund Cumulative Flows Flows into small cap and value funds are improving amid rising inflation. Image: BofA Global Investment Strategy
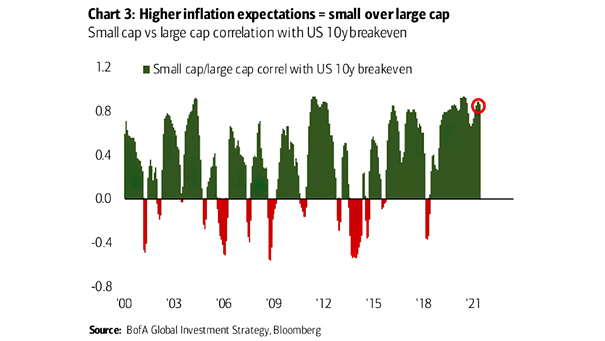
Small Cap vs. Large Cap Correlation with US 10-Year Breakeven When inflation expectations rise, small-caps tend to outperform large caps. Image: BofA Global Investment Strategy

Gold – Real Total Returns Based on U.S. CPI Regimes Historically, gold tends to do well when inflation is above 3% and rising. Image: Goldman Sachs Global Investment Research
Performance – S&P 500 Banks vs. S&P 500 and 2-10 Year Spreads Historically, banks tend to outperform the S&P 500 in periods of modest inflation. Image: BofA Global Research
Advanced Economies Debt/GDP and Advanced Economies Long-Term Rate Will rising debt lead to higher inflation and higher yields? Image: BofA Global Research
U.S. Cyclicals vs. Defensives and U.S. 10-Year Breakeven Will U.S. cyclicals continue to lag behind rising U.S. inflation expectations? Image: Goldman Sachs Global Investment Research
Annualized Performance of Various Asset Classes During the 1970s Gold and commodities tend to do well during periods of high inflation. Image: BofA Global Research
S&P 500 Cyclicals vs. Defensives Should investors expect temporary inflation spikes during the recovery and favor large tech stocks? Image: BofA Global Research
Major Central Bank Balance Sheets JPMorgan expects asset price inflation, as the expansion of global central bank balance sheets could reach $5tn in 2021. Image: Financial Times
Total Returns – Gold, Nasdaq and MSCI World ex-US With the Nasdaq at all-time high, markets expect a weak global growth, low inflation and a strong U.S. dollar. Image: Gavekal, Macrobond
Total Annual Health Care Spending Per U.S. Family Headlines say there’s no inflation, but U.S. health care costs have skyrocketed. The annual health care cost for U.S. families is $23,000 vs. $10,000 in 2003. Image: Deutsche Bank Global Research