OECD Composite Leading Indicators
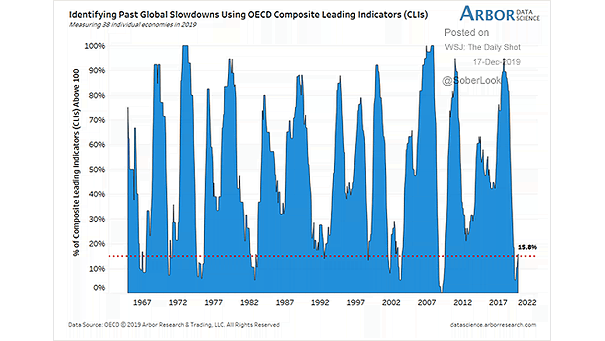
OECD Composite Leading Indicators Currently, 15.8% of OECD Composite Leading Indicators are above 100. Historically, equities have performed rather well at this level. Image: Arbor Research & Trading LLC
OECD Composite Leading Indicators Currently, 15.8% of OECD Composite Leading Indicators are above 100. Historically, equities have performed rather well at this level. Image: Arbor Research & Trading LLC
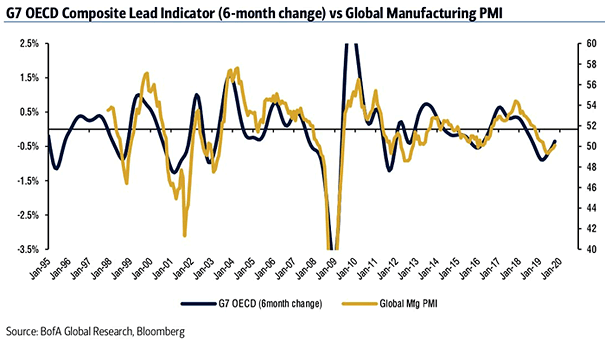
G7 OECD Composite Lead Indicator and Global Manufacturing PMI This chart also suggests a pick-up in the global manufacturing PMI, after having been in contraction territory. Image: BofA Global Research

MSCI ACWI Total Return Index vs. OECD Composite Leading Indicator Chart suggesting that usually, when the OECD composite leading indicator is up (slightly), it is positive for equity markets. Image: Tomasz Hońdo
PCE Inflation vs. Output Gap (Leading Indicator) Positive output gap suggests higher core inflation next year. Image: NBF Economics and Strategy
The Market Risk Indicator (Global Financial Stress Index) According to BofAML, the global financial stress index is a more accurate market risk indicator than VIX. Image: BofA Merrill Lynch Global Research
World Real Exports and Composite Trade Indicator Chart suggesting a recovery in world exports growth Image: Pictet Asset Management
Chinese Credit Growth and OECD Leading Indicator for China Chinese Credit growth rebounded in September and suggests stronger activity on the horizon. The OECD leading indicator for China picked up further at the highest level since 2017. Image: Danske Bank Research
Blue Chip Economic Indicators Surveys and Average Probability of U.S. Recession The probability of U.S. recession increases to 39% for 2020, based on Blue Chip Economic Indicators surveys. Image: J.P. Morgan
OECD Composite Leading Indicators Interesting chart showing the percentage of countries with OECD composite leading indices below the Unites States. Image: Bianco Research
Time Lags Between Indicators and Recessions Chart showing that credit standards, earnings and the yield curve are the earliest recession indicators. Image: Oxford Economics
Sentiment Indicator Are investors be too bullish? Currently, the sentiment indicator is above average at 1.2 standard deviations. Image: Goldman Sachs Global Investment Research