S&P 500 Forward Return and Two Consecutive 3% Declines
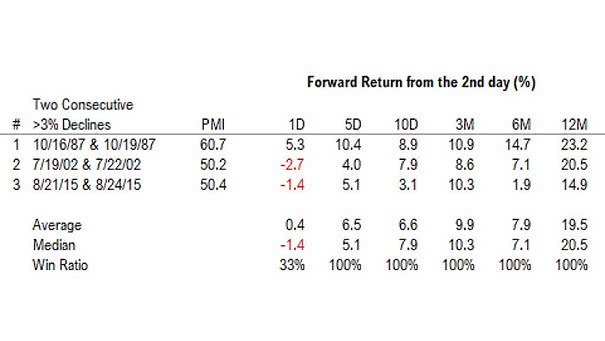
S&P 500 Forward Return and Two Consecutive 3% Declines This table suggests that the current sell-off is a correction in a bull market. Image: Fundstrat Global Advisors, LLC
S&P 500 Forward Return and Two Consecutive 3% Declines This table suggests that the current sell-off is a correction in a bull market. Image: Fundstrat Global Advisors, LLC
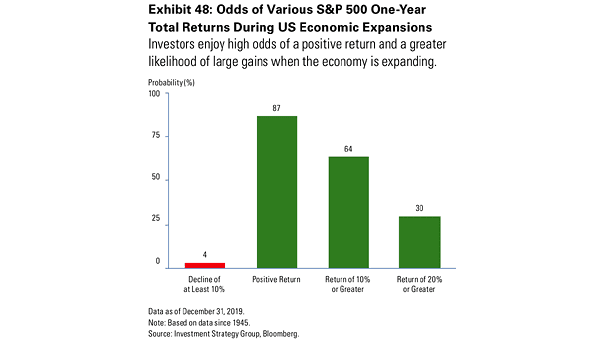
Odds of Various S&P 500 One-Year Total Returns During U.S. Economic Expansions This chart suggests the probability of positive one-year market returns when the U.S. economy is expanding. Image: Investment Strategy Group, Bloomberg

S&P 500 Total Return Index and U.S. High Yield/High Grade Chart suggesting a bullish market that is getting stretched and vulnerable. Image: BofA Global Investment Strategy
U.S. Presidential Elections and the Stock Market The first two years of presidential terms tend to produce below-average returns, while the next 2 years tend to produce above-average returns. Image: Fidelity Investments
Equity Flows vs. Equity Return Goldman Sachs is mildly bullish, suggesting that the demand for equity from funds could increase this year and support the stock market. Image: Goldman Sachs Global Investment Research
FAANG Stocks Dominate Returns since 2010 This chart shows the importance of FAANG stocks to the post-crisis market recovery. Image: Financial Times
S&P 500 Return in First Five Days vs. the Full Year Since 1950, when the stock market finished the first five days higher, the S&P 500 has been positive 82% of the time at year-end, with an average gain of 13.6%. Image: CNBC
S&P 500 Price to Book Value vs. Future Returns The current S&P 500 price to book value suggests that equity market returns will be low over the next 10 years (R² = 0.86). Image: Tomasz Hońdo
MSCI ACWI Total Return Index vs. OECD Composite Leading Indicator Chart suggesting that usually, when the OECD composite leading indicator is up (slightly), it is positive for equity markets. Image: Tomasz Hońdo
Cumulative Market Cap Growth vs. Cumulative Executed U.S. Buybacks Through the current cycle, U.S. buybacks have returned about $5.5 trillion to shareholders. Image: J.P. Morgan US Equity Strategy & Global Quantitative Research
Starting Valuation Predicts Future Returns Based on the Shiller CAPE ratio, the chart suggests a 10-year compound annual growth rate of only 2% to 4% for the U.S. stock market. Image: Fidelity Investments