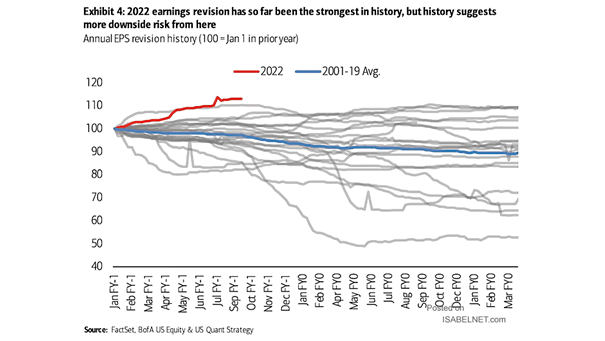
Earnings – Annual EPS Revision History
Earnings – Annual EPS Revision History Will 2022 earnings revisions decline? Image: BofA US Equity & Quant Strategy
Earnings – Annual EPS Revision History Will 2022 earnings revisions decline? Image: BofA US Equity & Quant Strategy
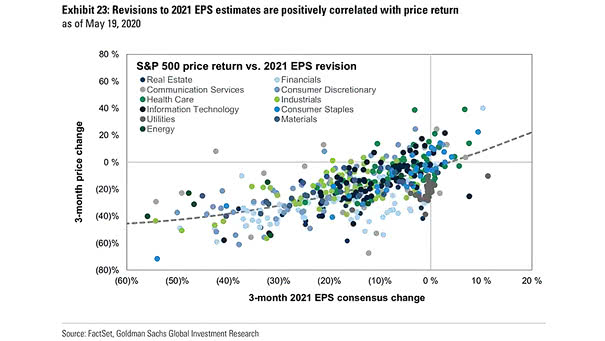
S&P 500 Price Return vs. 2021 EPS Revisions This chart highlights the positive correlation between price return and 2021 earnings revisions. Image: Goldman Sachs Global Investment Research

STOXX Europe 600 EPS Revisions This year, SXXP EPS revisions have not been worse than a typical year. Image: Goldman Sachs Global Investment Research
U.S. ISM Manufacturing Index and Cyclicals EPS Revision This chart shows the correlation between the ISM Manufacturing Index and cyclicals EPS revision, suggesting that 4Q19 will see a reset, with capital goods pricing in an actual earnings recession. Image: Morgan Stanley Research
S&P 500 1-Year Volatility vs. EPS Revisions This chart from SG shows a good correlation between earning revisions and the S&P 500 1-year volatility. You may also like “S&P 500 1-Month Volatility History Since 1928 and VIX Since 1990.” Image: Societe Generale Cross Asset Research
Revision to Consensus S&P 500 3Q EPS 2Q EPS fell by just 2% over the last 3 months, compared to the usual 4%. Image: BofA US Equity & Quant Strategy
S&P 500 Earnings Revisions Breadth and S&P 500 NTM EPS How will earnings growth drive the U.S. stock market? Image: Morgan Stanley Research
Revision to Consensus S&P 500 EPS Have consensus earnings estimates for 2021 the potential to rise again? Image: BofA US Equity & Quant Strategy
Typical Path of S&P 500 Bottom-Up Consensus EPS Estimate While economic and policy uncertainties have led to downward revisions in 2025 EPS estimates, this trend mirrors historical patterns and may contribute to a more optimistic market outlook. Image: Goldman Sachs Global Investment Research
Bottom-Up Consensus S&P 500 EPS Estimates Bottom-up consensus estimates show S&P 500 EPS growth slowing to 4% year-over-year in Q2 2025, highlighting a cautious earnings environment amid ongoing revisions and sector challenges. Image: Goldman Sachs Global Investment Research
Magnificent 6 (ex. NVDA) vs. S&P 493 Quarterly EPS YoY Growth The gap in EPS growth between mega-cap tech and the S&P 493 widened during 1Q 2025, as strong tech earnings and upward revisions contrasted with more cautious or downward-trending guidance for the broader market. Image: Goldman Sachs Global Investment Research