Euro Area Real M1 Growth Leads Euro Area Manufacturing PMI
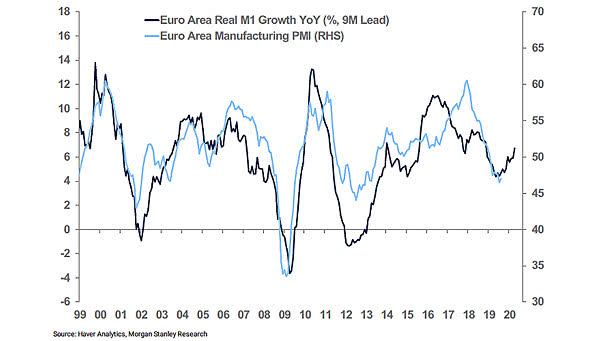
Euro Area Real M1 Growth Leads Euro Area Manufacturing PMI This chart suggests that euro area real M1 growth leads euro area manufacturing PMI by 9 months. Image: Morgan Stanley Research
Euro Area Real M1 Growth Leads Euro Area Manufacturing PMI This chart suggests that euro area real M1 growth leads euro area manufacturing PMI by 9 months. Image: Morgan Stanley Research
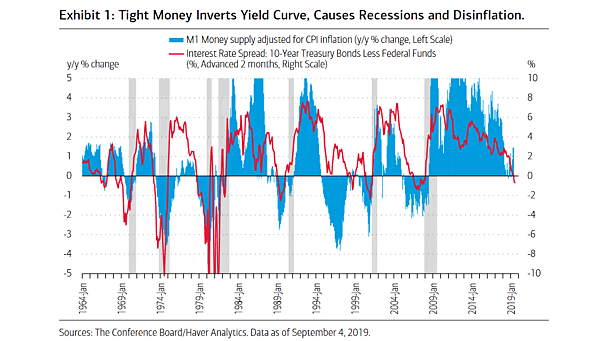
M1 Money Supply vs. Yield Curve and Recessions Great chart showing the correlation between M1 money supply and the yield curve. The key factor for inverted yield curves is tight money. Image: BofA Merrill Lynch Global Research

S&P 500 Index vs. Global M1 Liquidity Another good correlation between the S&P 500 Index and global M1 liquidity, while the Fed plans to stop quantitative tightening. The money supply M1 is the amount of effective money in the economy. Image: Nordea and Macrobond
Global Real M1 Growth Leads Global Manufacturing PMI by around 6 Months When global real M1 money supply growth is very low, it does not bode well for global economic activity. Image: The Wall Street Journal
What Does M1 Money Supply Growth Tell Us About the Next Recession? M1 is the money supply that includes types of money commonly used for payment, basically currency outside banks and checking account balances. This is not the perfect recession indicator, but in recent history, it turns negative at least one year before a recession.
PREMIUM MEMBERSHIP – Click the Images to Enlarge Video tutorials are available by clicking on this link: “FORECASTING MODELS” located in the menu bar at the top of each page. Our daily Stock Market Bull and Bear Indicator is available in the Pro Membership. Upgrade your Premium Membership to a Pro Membership Now! The period of…
PRO MEMBERSHIP – Click the Images to Enlarge Video tutorials are available by clicking on this link: “FORECASTING MODELS” located in the menu bar at the top of each page.
BASIC MEMBERSHIP – Click the Images to Enlarge Video tutorials are available by clicking on this link: “FORECASTING MODELS” located in the menu bar at the top of each page. Our daily Stock Market Bull and Bear Indicator is available in the Pro Membership. Upgrade your Basic Membership to a Pro Membership Now! The period of…
Advanced Stock Market Forecast 95% Correlation since 1970 Stock Market Valuation Short- and Long-Term Forecasts Bull and Bear Indicator Equity Risk Premium R² = 0.90 since 1970 For Professionals and Individuals View More Subscribe Now! Check out our Stock Market Forecasting Models “Your results are very interesting” Howard Marks Legendary investor Our Features Five Advanced…