Growth Across 45 OECD Tracked Countries
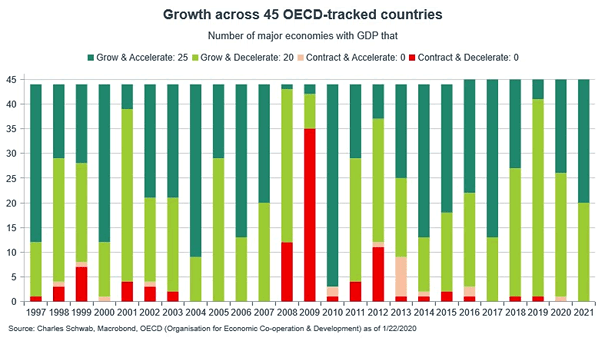
Growth Across 45 OECD Tracked Countries Chart suggesting stable growth this year and accelerating growth next year. Image: Charles Schwab
Growth Across 45 OECD Tracked Countries Chart suggesting stable growth this year and accelerating growth next year. Image: Charles Schwab
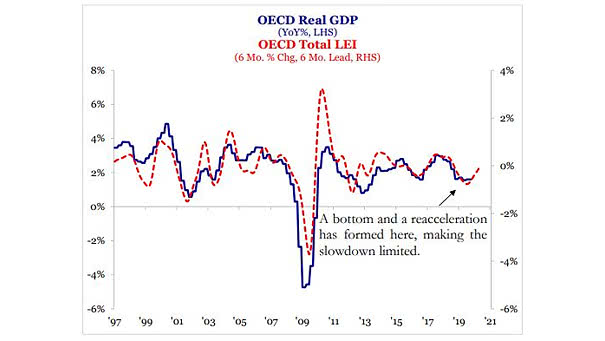
OECD Total LEI lead OECD Real GDP This chart suggests that the OECD’s leading economic indicators lead OCDE real GDP by 6 months. Image: Strategas

Global Economy – OECD Composite Leading Indicator (CLI) The OECD Composite Leading Indicator (CLI) is rising and suggests that a global economic recovery is underway. Image: Macrobond
OECD Composite Leading Indicators Currently, 15.8% of OECD Composite Leading Indicators are above 100. Historically, equities have performed rather well at this level. Image: Arbor Research & Trading LLC
G7 OECD Composite Lead Indicator and Global Manufacturing PMI This chart also suggests a pick-up in the global manufacturing PMI, after having been in contraction territory. Image: BofA Global Research
Cumulative Interest Rate Cuts in OECD Countries Central banks in OECD countries haven’t cut this much since the Great Financial Crisis. Image: Deutsche Bank Global Research
OECD LEI Tends to Lead Global Manufacturing PMI by 6 Months Chart suggesting a pick-up in the global manufacturing PMI. Image: Nordea and Macrobond
MSCI ACWI Total Return Index vs. OECD Composite Leading Indicator Chart suggesting that usually, when the OECD composite leading indicator is up (slightly), it is positive for equity markets. Image: Tomasz Hońdo
OECD Diffusion Index Leads Global Manufacturing PMI Chart suggesting that the OECD diffusion index leads global manufacturing PMI by 6 months. Image: Pictet Asset Management
MSCI World Index vs. OECD Unemployment Rate and U.S. Consumer Confidence Chart suggesting that OECD unemployment troughs and very confident U.S. consumers do not generally bode well for global equities. Image: Morgan Stanley Research
Chinese Credit Growth and OECD Leading Indicator for China Chinese Credit growth rebounded in September and suggests stronger activity on the horizon. The OECD leading indicator for China picked up further at the highest level since 2017. Image: Danske Bank Research