U.S. Economy vs. Asset Prices
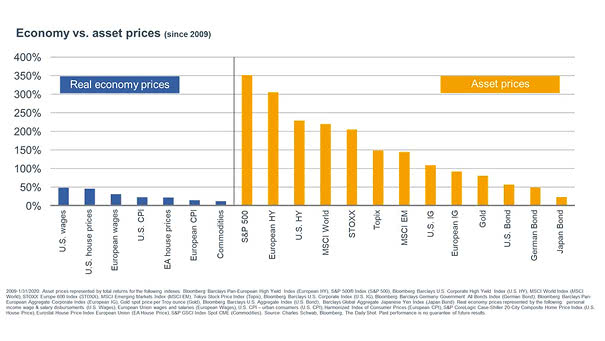
U.S. Economy vs. Asset Prices Persistent low interest rates could explain the wide divergence between real economy prices and asset prices, over the past decade. Image: Charles Schwab
U.S. Economy vs. Asset Prices Persistent low interest rates could explain the wide divergence between real economy prices and asset prices, over the past decade. Image: Charles Schwab
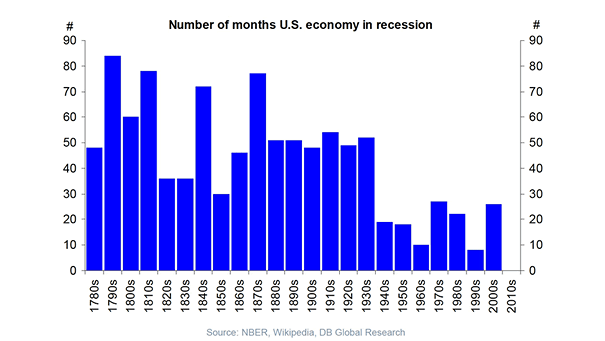
Number of Months U.S. Economy in Recession The 2010s are the first time a decade has gone without the U.S. falling into recession. Image: Deutsche Bank Global Research

Asia Pacific Economic Data Leads the U.S. Economy This chart suggests that Asia Pacific economic data leads the U.S. economy since the Great Financial Crisis. U.S. economic data becomes laggard. Image: Arbor Research & Trading LLC
City Economic Surprise Index – U.S. Economy vs. Global Economy Nice chart showing that the U.S. relative economic outperformance. Image: Quill Intelligence, LLC
U.S. Economy and U.S. 10-Year Yield This chart suggests that the U.S. economy’s percentile relative to developed countries explains the U.S. 10-year yield. Image: Arbor Research & Trading LLC
Manufacturing’s Share of the U.S. Economy Manufacturing accounts for only 10% of U.S. GDP, but 25% to 45% of the market response. Image: Goldman Sachs Global Investment Research
Correlation Between the U.S. Economy and the World Economy This chart suggests that the U.S. economy has lagged the world economy since the Great recession. Image: Arbor Research & Trading LLC
Americans Split on Description of U.S. Economy Today, 43% of Americans think socialism would be a good thing for the U.S.. Image: Gallup
Is The U.S. Economy Slowing Down? The chart below shows that the U.S. economy is slowing down. The U.S.-China trade war and slower global growth are not helping. But as long as there is no recession, slowing down is fine.
U.S. Economy Has Prospered While Europe Has Slowed This chart shows how the US economy is strong compared to European countries. And despite full employment, US real GDP should stay above potential GDP. Image: Financial Times
How’s the U.S. Economy Doing Now? The real GDP Nowcast relies on soft data such as consumer and business surveys and hard data such as retail sales and industrial production. It forecasts the growth of real GDP. At full employment, GDP returns to the level of potential GDP. If a recession were to occur today,…