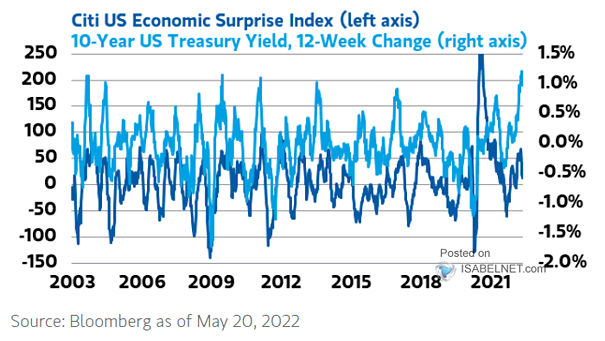
Citi U.S. Economic Surprise Index vs. 10-Year U.S. Treasury Yield
Citi U.S. Economic Surprise Index vs. 10-Year U.S. Treasury Yield Should investors expect U.S. Treasuries to rally? Image: Morgan Stanley Research
Citi U.S. Economic Surprise Index vs. 10-Year U.S. Treasury Yield Should investors expect U.S. Treasuries to rally? Image: Morgan Stanley Research
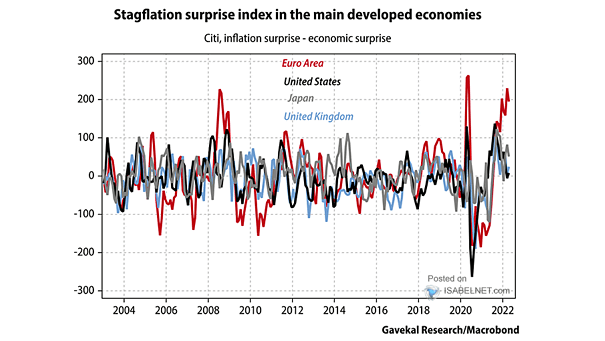
Inflation Surprise – Economic Surprise The risk of stagflation in the euro area is increasing significantly. Image: Gavekal, Macrobond

Economic Surprises Index – China vs. G10 Economies Will G10 economies follow China? Image: BCA Research
U.S. IG Credit Spread and S&P 500 vs. Citi U.S. Economic Surprise Index Chart suggesting that since mid-May, the rally has been driven by positive macroeconomic factors. Image: BofA Global Research
Citi Economic Surprise Index and 10-Year Treasury Note Yield Are bonds risky? The Citi Economic Surprise Index suggests that bond yields could rise. Image: Renaissance Macro Research
Citi Economic Surprise Index and S&P 500 This chart highlights the current divergence between the Citi Economic Surprise Index and the S&P 500. Image: BofA Global Research
Correlation – Euro Equities and Economic Surprise The correlation between euro equities and economic surprise has diverged recently. Image: Oxford Economics
City Economic Surprise Index – U.S. Economy vs. Global Economy Nice chart showing that the U.S. relative economic outperformance. Image: Quill Intelligence, LLC
Citi Economic Surprise Index and S&P 500 The Citi Economic Surprise Index has risen sharply, but it has an inconsistent history in terms of its correlation with the S&P 500. It is a cyclical indicator: high readings suggest favouring defensives over cyclicals, and low readings suggest favouring cyclicals over defensives. Image: Renaissance Macro
Citi Economic Surprise Index vs. EUR/USD Weaker European growth relative to the U.S. could weaken Euro/U.S. Dollar. Image: Credit Suisse
Citi Global Economic Surprise Index and Baltic Dry Index The divergence between the Baltic Dry Index and the Citi Global Economic Surprise Index could suggest that “global economy is likely to bottom soon.” Image: Nomura