Global GDP vs. Current Activity Indicator (CAI)
Global GDP vs. Current Activity Indicator (CAI) Goldman Sachs forecasts global real GDP growth of -3.3% in 2020 and 6.4% in 2021. Image: Goldman Sachs Global Investment Research
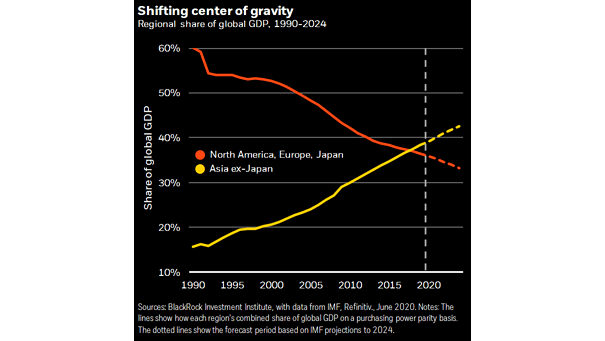
Regional Share of Global GDP – North America, Europe and Japan vs. Asia ex-Japan Shifting patterns of global growth? This chart suggests that the center of gravity of global growth is shifting toward Asia. Image: BlackRock Investment Institute
Global GDP Growth Forecasts BofA has revised lower 2020 GDP growth for 28 of 43 countries. Image: BofA Global Research
S&P 500, Treasury Bond, Global GDP, EUR/USD – Protracted Scenario Projections This table suggests protracted scenario projections. Image: Deutsche Bank Research
Global GDP Growth Scenarios Deutsche Bank expects two quarters of global negative growth in 2020. Image: Deutsche Bank
Coronavirus Scenarios and Impact on Global GDP This table suggests the impact of the coronavirus on global GDP. Image: Pictet Asset Management
Baseline Scenario: Impact of Coronavirus on 2020 Annualized Global Growth (Global GDP) Goldman Sachs expects global growth to remain weak in Q2, and a rebound later in the year. Image: Goldman Sachs Global Investment Research
2020 Global GDP Growth Forecasts BofA cuts global growth to 2.8% in 2020. Image: BofA Global Research
Global GDP Growth in Pandemic Scenarios This chart suggests world GDP growth in the event of a global pandemic. Image: Oxford Economics
Expected Impact of Coronavirus on Global GDP Growth Chart suggesting that in the first quarter of 2020, the Chinese economy will experience its slowest growth since the global financial crisis. Image: Financial Times