Total U.S. Household Debt Balance and Its Composition
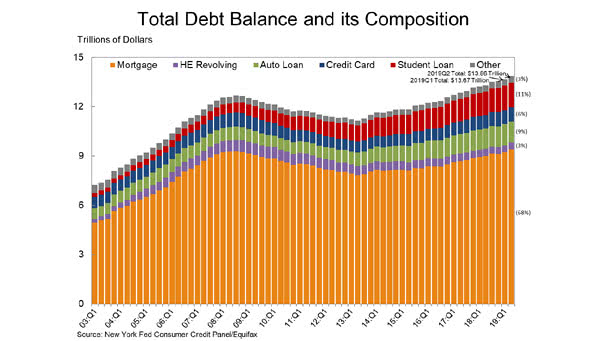
Total U.S. Household Debt Balance and Its Composition Total U.S. household debt increased by $192 billion (1.4%) to $13.86 trillion in Q2 2019. Image: New York Fed Consumer Credit Panel
Total U.S. Household Debt Balance and Its Composition Total U.S. household debt increased by $192 billion (1.4%) to $13.86 trillion in Q2 2019. Image: New York Fed Consumer Credit Panel
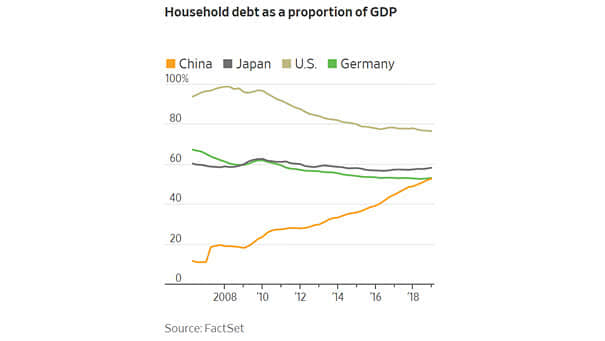
Household Debt as a Proportion of GDP Household debt levels in China are equivalent to those in advanced economies. Image: The Wall Street Journal

U.S. Household Debt and World Trade This chart shows the pretty good correlation between U.S. household debt and world trade. Image: Oxford Economics, Macrobond
Is U.S. Household Debt a Problem? Not really, right now. Actually, the level of household debt alone does not tell an accurate picture of the current situation. However, U.S. household debt to GDP is much lower, U.S. household debt service payments as a percent of disposable personal income and U.S. household financial obligations as a percent…
U.S. Public Debt and Household Net Worth More government debt tends to increase household net worth. Image: Alpine Macro
Households and Corporations Debt to GDP and Total Fed Holdings Since the Great Financial Crisis, the private sector has de-leveraged, while the Fed’s balance sheet has risen sharply. Image: Goldman Sachs Global Investment Research
Debt to Net Worth Ratio for U.S. Households vs. Financial Obligations Ratio Chart suggesting that U.S. household finances are in good shape. This is good news for consumption spending, which accounts for about 70% of all U.S. economic activity. Image: NBF Economics and Strategy
U.S. Debt Ratios to GDP (Household, Corporate, Government) U.S. households remain far less in debt than during the Great Recession, but U.S. corporate debt continues to rise rapidly and has exceeded record levels . Image: Pictet Wealth Management
Leverage in the U.S.: Households and Corporations This chart shows the divergence between U.S. non-financial corporations leverage and households leverage. U.S. corporation debt reached a record level of $10.12tn. Image: Gavekal, Macrobond
U.S. Student Debt, Auto Loan Debt, Credit Card Balance, per Capita Household debt balances have been rising steadily in recent years. Image: Deutsche Bank Global Research
Detecting and Measuring Asset Bubbles Detecting and measuring asset bubbles is not always an easy task. This chart puts into perspective the current U.S. households financial assets to GDP and the U.S. federal debt as percentage of GDP.