Rolling 12-Month Change in Cumulative ETF Inflows
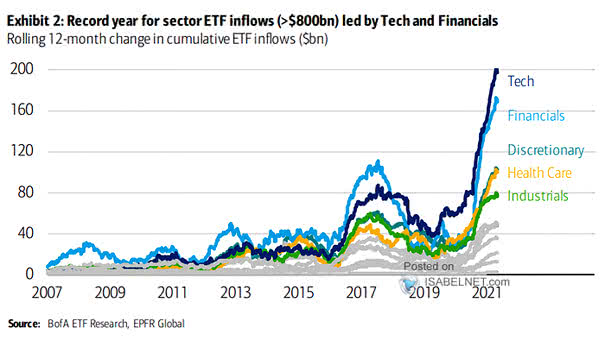
Rolling 12-Month Change in Cumulative ETF Inflows ETF inflows into the tech and financial sectors remain strong. Image: BofA ETF Research
Rolling 12-Month Change in Cumulative ETF Inflows ETF inflows into the tech and financial sectors remain strong. Image: BofA ETF Research
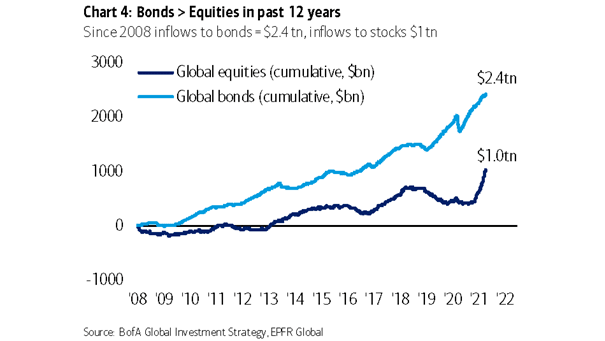
Inflows – Bonds vs. Equities in Past 12 Years Since 2008, inflows into global bonds of $2.4tn still exceed inflows into global equities of $1.0tn. Image: BofA Global Investment Strategy

Inflows to Global Equity Funds Inflows to global equity funds in the past 5 months of $569 billion exceed inflows in the prior 12 years of $452 billion. Image: BofA Global Investment Strategy
% Share of Rolling Three-Month ETF Inflows Investors favored risky assets over government bonds to end 2020. Image: Arbor Research & Trading LLC Click the Image to Enlarge
2020 Inflows: Equities, Bonds, Cash and Gold There is still a lot of cash on the sideline, which could be put to work in the market. Image: BofA Global Investment Strategy
Inflows as % of Assets Under Management (AUM) Cash, gold and tech are the largest inflows this year, amid the coronavirus pandemic. Image: BofA Global Investment Strategy
Net Inflows to Value vs. Growth ETFs Greatest inflows to value vs. growth ETFs in history. Should investors forget growth stocks? Image: BofA Research Investment Committee
Gold Inflows Since 2018 More retail investors are turning to gold investment. Image: BofA Global Research
Tech Inflows Investors continue to rush into tech, despite the growing concerns of a potential bubble forming in the tech sector. Image: BofA Global Investment Strategy
Gold Fund Flows – Record 6-Week Inflow to Gold Investors poured record amounts into gold funds. Image: BofA Global Investment Strategy
Flow – % Share of Rolling Three-Month ETF Inflows Investors reduced their equity exposure. Over the past 3 months, nearly 50% of all ETF inflows have funneled into HY, IG and Agg bonds. Image: Arbor Research & Trading LLC