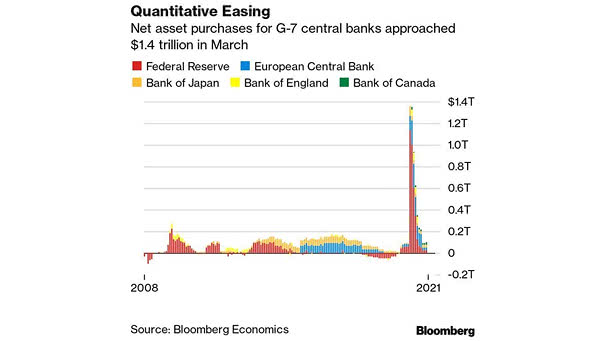
Quantitative Easing – Net Asset Purchases for G-7 Central Banks
Quantitative Easing – Net Asset Purchases for G-7 Central Banks Net asset purchases for G-7 central banks approached $1.4 trillion in March. To put things in perspective, this is more than five times higher than the previous peak of $270 billion in April 2009. Image: Bloomberg